Significant proportions of nuclear transport proteins with reduced intracellular mobilities resolved by fluorescence correlation spectroscopy - PubMed (original) (raw)
Significant proportions of nuclear transport proteins with reduced intracellular mobilities resolved by fluorescence correlation spectroscopy
Allison Paradise et al. J Mol Biol. 2007.
Abstract
Nuclear transport requires freely diffusing nuclear transport proteins to facilitate movement of cargo molecules through the nuclear pore. We analyzed dynamic properties of importin alpha, importin beta, Ran and NTF2 in nucleus, cytoplasm and at the nuclear pore of neuroblastoma cells using fluorescence correlation spectroscopy. Mobile components were quantified by global fitting of autocorrelation data from multiple cells. Immobile components were quantified by analysis of photobleaching kinetics. Wild-type Ran was compared to various mutant Ran proteins to identify components representing GTP or GDP forms of Ran. Untreated cells were compared to cells treated with nocodazole or latrunculin to identify components associated with cytoskeletal elements. The results indicate that freely diffusing importin alpha, importin beta, Ran and NTF2 are in dynamic equilibrium with larger pools associated with immobile binding partners such as microtubules in the cytoplasm. These findings suggest that formation of freely diffusing nuclear transport intermediates is in competition with binding to immobile partners. Variation in concentrations of freely diffusing nuclear transport intermediates among cells indicates that the nuclear transport system is sufficiently robust to function over a wide range of conditions.
Figures
Figure 1. Fluorescence correlation spectroscopy in live cells
The diagram illustrates fluorescent protein microinjected into a live cell positioned on a microscope cover slip. The inverted objective focuses the laser beam to form the observation volume. . Ellipsoids drawn approximately to scale, indicate the FCS observation volume positioned in cytoplasm, nucleus, or at the nuclear envelope.
Figure 2. FCS analysis of allophycocyanin and importin β in vitro and in vivo
Autocorrelation functions for APC and importin β labeled with Alexa Fluor 647 were measured in vitro and inside live cells and normalized. Autocorrelation data for both APC and importin β in vitro were fitted with a single decay time τ = 300 μs. Autocorrelation data for APC in vivo was fitted with a decay time τ = 1000 μs. Autocorrelation data for importin β in vivo required multiple decay times for an adequate fit.
Figure 3. Confocal imaging of cells injected with fluorescently labeled nuclear transport proteins
Intrinsically fluorescent APC and Alexa Fluor 647 labeled importin β, importin α, NTF2, Ran, RanE70A, RanT24N and RanQ69L were microinjected into the cytoplasm of B104 cells. After 30–60 minutes the injected cells were imaged by confocal microscopy. Scale bar indicates 10 μm.
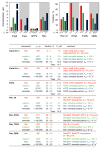
Figure 4. FCS analysis of nuclear transport proteins in nucleus
Fluorescently labeled importin β, importin α, NTF2, Ran, RanE70A, RanT24N and RanQ69L labeled with Alexa Fluor 647 were microinjected into cytoplasm of B104 cells. After injected protein achieved steady state nucleocytoplasmic distribution, FCS measurements were performed with confocal volume positioned inside nucleus. For each protein at least 30 cells were analyzed. Autocorrelation data from all cells were globally fitted to resolve protein populations with different mobilities. Immobile fraction for each protein was determined from photobleaching amplitudes. Concentrations for each population were calculated based on total concentration and nucleocytoplasmic distribution of endogenous protein. Concentrations of each component are shown on bar graphs and in the table. Fast, medium, slow and immobile populations are labeled with red, green, blue, and black colors respectively. For mutant Ran proteins, the fraction of each population is shown compared with wt Ran. The table shows autocorrelation decay times (τ D), fractions, and concentrations for each population. Molecular species comprising each population and calculated diffusion coefficients or off rates are listed.
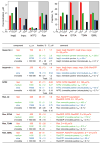
Figure 5. FCS analysis of nuclear transport proteins in cytoplasm
Mobilities of microinjected nuclear transport proteins in cytoplasm were analyzed by FCS. For each protein at least 20 cells were analyzed. Autocorrelation data from all cells were globally fitted to resolve protein populations with different mobilities. Immobile fraction for each protein was determined from photobleaching amplitudes. Concentrations for each population were calculated based on total concentration and nucleocytoplasmic distribution of endogenous protein. Concentrations of each component are shown on bar graphs and in the table. Fast, medium, slow and immobile populations are labeled with red, green, blue, and black colors respectively. For mutant Ran proteins, the fraction of each population is shown compared with wt Ran. The table shows autocorrelation decay times (τ D), fractions, and concentrations for each population. Molecular species comprising each population and calculated diffusion coefficients or off rates are listed.
Figure 6. FCS analysis of nuclear transport proteins in nocodazole treated cells
B104 cells were treated with nocodazole to disrupt microtubules followed by microinjection of nuclear transport proteins. Mobilities of each protein were analyzed by FCS with observation volume positioned in the cytoplasm. For each protein at least 20 cells were analyzed. Bar graph indicates relative changes in concentrations of fast (red), medium (green), slow (blue) and immobile (black) components in nocodazole treated cells compared to untreated cells.
Figure 7. FCS analysis of nuclear transport proteins in NPC
Importin β, importin α, NTF2, Ran wt, RanE70A, RanT24N and RanQ69L labeled with Alexa Fluor 647 were microinjected into the cytoplasm of B104 cells. Cells were incubated for 30–60 minutes after injection and analyzed by FCS with observation volume positioned over the nuclear envelope. For each protein at least 20 cells were analyzed. To resolve protein populations specific to NPC and nuclear envelope, contributions from adjacent nucleoplasm and cytoplasm were subtracted by a global fitting procedure. Number of molecules per NPC for each protein component was calculated based on number of pores encompassed by FCS observation volume. Distributions of each protein between populations with different mobilities are shown on bar graphs and in the table. Fast, medium, slow and immobile populations are labeled with red, green, blue, and black colors respectively. For mutant Ran proteins, the fraction of each component compared with wt Ran is shown. The table shows autocorrelation decay times (τ D), concentrations, numbers of molecules per NPC, or fractions for each population. Molecular species comprising each population and calculated diffusion coefficients or off rates are listed.
Figure 8. Molecular interactions of nuclear transport proteins
Molecular interactions during nuclear transport are shown for NLS-containing cargo molecule (orange), importin α (light green), importin β (dark green), Ran (red), NTF2 (cyan), CAS (blue), immobile binging partners (cross hatched), microtubules (cylinders) and NPC (black). Freely diffusing molecules are shown in unshaded regions, molecules bound to medium, slow or immobile partners are shown in shaded regions in nucleus and cytoplasm.
Similar articles
- Thioredoxin-related transmembrane protein 2 (TMX2) regulates the Ran protein gradient and importin-β-dependent nuclear cargo transport.
Oguro A, Imaoka S. Oguro A, et al. Sci Rep. 2019 Oct 25;9(1):15296. doi: 10.1038/s41598-019-51773-x. Sci Rep. 2019. PMID: 31653923 Free PMC article. - Characterization of the nuclear import pathway for BLM protein.
Duan Z, Zhao J, Xu H, Xu H, Ji X, Chen X, Xiong J. Duan Z, et al. Arch Biochem Biophys. 2017 Nov 15;634:57-68. doi: 10.1016/j.abb.2017.09.019. Epub 2017 Oct 7. Arch Biochem Biophys. 2017. PMID: 29017749 - [Nucleocytoplasmic transport mediated by importin-β family members].
Kimura M. Kimura M. Seikagaku. 2015 Feb;87(1):7-15. Seikagaku. 2015. PMID: 26571549 Review. Japanese. No abstract available. - Nuclear transport of single molecules: dwell times at the nuclear pore complex.
Kubitscheck U, Grünwald D, Hoekstra A, Rohleder D, Kues T, Siebrasse JP, Peters R. Kubitscheck U, et al. J Cell Biol. 2005 Jan 17;168(2):233-43. doi: 10.1083/jcb.200411005. J Cell Biol. 2005. PMID: 15657394 Free PMC article. - Importin alpha: a multipurpose nuclear-transport receptor.
Goldfarb DS, Corbett AH, Mason DA, Harreman MT, Adam SA. Goldfarb DS, et al. Trends Cell Biol. 2004 Sep;14(9):505-14. doi: 10.1016/j.tcb.2004.07.016. Trends Cell Biol. 2004. PMID: 15350979 Review.
Cited by
- Biology and biophysics of the nuclear pore complex and its components.
Lim RY, Ullman KS, Fahrenkrog B. Lim RY, et al. Int Rev Cell Mol Biol. 2008;267:299-342. doi: 10.1016/S1937-6448(08)00632-1. Int Rev Cell Mol Biol. 2008. PMID: 18544502 Free PMC article. Review. - In vivo analysis of protein crowding within the nuclear pore complex in interphase and mitosis.
Konishi HA, Asai S, Watanabe TM, Yoshimura SH. Konishi HA, et al. Sci Rep. 2017 Jul 18;7(1):5709. doi: 10.1038/s41598-017-05959-w. Sci Rep. 2017. PMID: 28720791 Free PMC article. - Model inspired by nuclear pore complex suggests possible roles for nuclear transport receptors in determining its structure.
Osmanović D, Ford IJ, Hoogenboom BW. Osmanović D, et al. Biophys J. 2013 Dec 17;105(12):2781-9. doi: 10.1016/j.bpj.2013.11.013. Biophys J. 2013. PMID: 24359750 Free PMC article. - Selective transport control on molecular velcro made from intrinsically disordered proteins.
Schleicher KD, Dettmer SL, Kapinos LE, Pagliara S, Keyser UF, Jeney S, Lim RY. Schleicher KD, et al. Nat Nanotechnol. 2014 Jul;9(7):525-30. doi: 10.1038/nnano.2014.103. Epub 2014 Jun 15. Nat Nanotechnol. 2014. PMID: 24929341 - Karyopherins regulate nuclear pore complex barrier and transport function.
Kapinos LE, Huang B, Rencurel C, Lim RYH. Kapinos LE, et al. J Cell Biol. 2017 Nov 6;216(11):3609-3624. doi: 10.1083/jcb.201702092. Epub 2017 Sep 1. J Cell Biol. 2017. PMID: 28864541 Free PMC article.
References
- Dasso M. The Ran GTPase: theme and variations. Curr Biol. 2002;12:R502–8. - PubMed
- Quimby BB, Dasso M. The small GTPase Ran: interpreting the signs. Curr Opin Cell Biol. 2003;15:338–44. - PubMed
- Stochaj U, Rother KL. Nucleocytoplasmic trafficking of proteins: with or without Ran? Bioessays. 1999;21:579–589.
- Magde D, Elson E, Webb WW. Thermodynamic Fluctuations in a Reacting System---Measurement by Fluorescence Correlation Spectroscopy. Physical Review Letters. 1972;29:705–708.
Publication types
MeSH terms
Substances
Grants and funding
- RR22232/RR/NCRR NIH HHS/United States
- NS15190/NS/NINDS NIH HHS/United States
- R56 NS015190/NS/NINDS NIH HHS/United States
- P41 RR013186/RR/NCRR NIH HHS/United States
- S10 RR022624/RR/NCRR NIH HHS/United States
- R01 NS015190/NS/NINDS NIH HHS/United States
- U54 RR022232/RR/NCRR NIH HHS/United States
- RR13186/RR/NCRR NIH HHS/United States
LinkOut - more resources
Full Text Sources
Miscellaneous


