Quantitative genetics of cortical bone mass in healthy 10-year-old children from the Fels Longitudinal Study - PubMed (original) (raw)
Quantitative genetics of cortical bone mass in healthy 10-year-old children from the Fels Longitudinal Study
Dana L Duren et al. Bone. 2007 Feb.
Abstract
The genetic influences on bone mass likely change throughout the life span, but most genetic studies of bone mass regulation have focused on adults. There is, however, a growing awareness of the importance of genes influencing the acquisition of bone mass during childhood on lifelong bone health. The present investigation examines genetic influences on childhood bone mass by estimating the residual heritabilities of different measures of second metacarpal bone mass in a sample of 600 10-year-old participants from 144 families in the Fels Longitudinal Study. Bivariate quantitative genetic analyses were conducted to estimate genetic correlations between cortical bone mass measures, and measures of bone growth and development. Using a maximum likelihood-based variance components method for pedigree data, we found a residual heritability estimate of 0.71 for second metacarpal cortical index. Residual heritability estimates for individual measures of cortical bone (e.g., lateral cortical thickness, medial cortical thickness) ranged from 0.47 to 0.58, at this pre-pubertal childhood age. Low genetic correlations were found between cortical bone measures and both bone length and skeletal age. However, after Bonferonni adjustment for multiple testing, rho(G) was not significantly different from 0 for any of these pairs of traits. Results of this investigation provide evidence of significant genetic control over bone mass largely independent of maturation while bones are actively growing and before rapid accrual of bone that typically occurs during puberty.
Figures
Figure 1
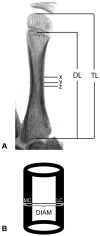
Measurements. (A) Inverted x-ray of metacarpal; TL = total length, DL = diaphyseal length, X = mid-point of TL, Y = minimum shaft width, Z = mid-point of DL. (B) Diagram of measurement to be taken at each of the above locations; MC = medial cortex, LC = lateral cortex, DIAM = total diameter.
Similar articles
- Skeletal growth and the changing genetic landscape during childhood and adulthood.
Duren DL, Seselj M, Froehle AW, Nahhas RW, Sherwood RJ. Duren DL, et al. Am J Phys Anthropol. 2013 Jan;150(1):48-57. doi: 10.1002/ajpa.22183. Am J Phys Anthropol. 2013. PMID: 23283664 Free PMC article. - Heritability of calcaneal quantitative ultrasound measures in healthy adults from the Fels Longitudinal Study.
Lee M, Czerwinski SA, Choh AC, Towne B, Demerath EW, Chumlea WC, Sun SS, Siervogel RM. Lee M, et al. Bone. 2004 Nov;35(5):1157-63. doi: 10.1016/j.bone.2004.07.007. Bone. 2004. PMID: 15542041 - Unique and common genetic effects between bone mineral density and calcaneal quantitative ultrasound measures: the Fels Longitudinal Study.
Lee M, Czerwinski SA, Choh AC, Demerath EW, Sun SS, Chumlea WC, Towne B, Siervogel RM. Lee M, et al. Osteoporos Int. 2006;17(6):865-71. doi: 10.1007/s00198-006-0075-4. Epub 2006 Mar 16. Osteoporos Int. 2006. PMID: 16541205 - Pubertal timing, bone acquisition, and risk of fracture throughout life.
Bonjour JP, Chevalley T. Bonjour JP, et al. Endocr Rev. 2014 Oct;35(5):820-47. doi: 10.1210/er.2014-1007. Epub 2014 Aug 25. Endocr Rev. 2014. PMID: 25153348 Review. - Bone mass acquisition in healthy children.
Davies JH, Evans BA, Gregory JW. Davies JH, et al. Arch Dis Child. 2005 Apr;90(4):373-8. doi: 10.1136/adc.2004.053553. Arch Dis Child. 2005. PMID: 15781927 Free PMC article. Review.
Cited by
- Skeletal growth and the changing genetic landscape during childhood and adulthood.
Duren DL, Seselj M, Froehle AW, Nahhas RW, Sherwood RJ. Duren DL, et al. Am J Phys Anthropol. 2013 Jan;150(1):48-57. doi: 10.1002/ajpa.22183. Am J Phys Anthropol. 2013. PMID: 23283664 Free PMC article. - Tracking of appendicular bone mineral density for 6 years including the pubertal growth spurt: Japanese Population-based Osteoporosis kids cohort study.
Fujita Y, Iki M, Ikeda Y, Morita A, Matsukura T, Nishino H, Yamagami T, Kagamimori S, Kagawa Y, Yoneshima H. Fujita Y, et al. J Bone Miner Metab. 2011 Mar;29(2):208-16. doi: 10.1007/s00774-010-0213-0. Epub 2010 Aug 14. J Bone Miner Metab. 2011. PMID: 20711620 - Usual Dietary Intake, Nutritional Adequacy and Food Sources of Calcium, Phosphorus, Magnesium and Vitamin D of Spanish Children Aged One to <10 Years. Findings from the EsNuPI Study.
Cuadrado-Soto E, López-Sobaler AM, Jiménez-Ortega AI, Aparicio A, Bermejo LM, Hernández-Ruiz Á, Lara Villoslada F, Leis R, Martínez de Victoria E, Moreno JM, Ruiz-López MD, Soto-Méndez MJ, Valero T, Varela-Moreiras G, Gil Á, Ortega RM. Cuadrado-Soto E, et al. Nutrients. 2020 Jun 16;12(6):1787. doi: 10.3390/nu12061787. Nutrients. 2020. PMID: 32560110 Free PMC article. - The influence of age at menarche on cross-sectional geometry of bone in young adulthood.
Sešelj M, Nahhas RW, Sherwood RJ, Chumlea WC, Towne B, Duren DL. Sešelj M, et al. Bone. 2012 Jul;51(1):38-45. doi: 10.1016/j.bone.2012.03.030. Epub 2012 Apr 5. Bone. 2012. PMID: 22513271 Free PMC article. - The National Osteoporosis Foundation's position statement on peak bone mass development and lifestyle factors: a systematic review and implementation recommendations.
Weaver CM, Gordon CM, Janz KF, Kalkwarf HJ, Lappe JM, Lewis R, O'Karma M, Wallace TC, Zemel BS. Weaver CM, et al. Osteoporos Int. 2016 Apr;27(4):1281-1386. doi: 10.1007/s00198-015-3440-3. Epub 2016 Feb 8. Osteoporos Int. 2016. PMID: 26856587 Free PMC article. Review.
References
- Akhter MP, Iwaniec UT, Covey MA, Cullen DM, Kimmel DB, Recker RR. Genetic variations in bone density, histomorphometry, and strength in mice. Calcif Tissue Int. 2000;67:337–344. - PubMed
- Audi L, Garcia-Ramirez M, Carrascosa A. Genetic determinants of bone mass. Horm Res. 1999;51:105–123. - PubMed
- Barnett E, Nordin BEC. The radiological diagnosis of osteoporosis: a new approach. Clin Radiol. 1960;11:166–174. - PubMed
- Beamer WG, Donahue LR, Rosen CJ, Baylink DJ. Genetic variability in adult bone density among inbred strains of mice. Bone. 1996;18:397–403. - PubMed
Publication types
MeSH terms
Grants and funding
- AR052147/AR/NIAMS NIH HHS/United States
- R01 AR052147/AR/NIAMS NIH HHS/United States
- HD36342/HD/NICHD NIH HHS/United States
- R01 HD012252/HD/NICHD NIH HHS/United States
- HD12252/HD/NICHD NIH HHS/United States
- R01 HD036342/HD/NICHD NIH HHS/United States
LinkOut - more resources
Full Text Sources
Medical
