General structural motifs of amyloid protofilaments - PubMed (original) (raw)
General structural motifs of amyloid protofilaments
Neil Ferguson et al. Proc Natl Acad Sci U S A. 2006.
Abstract
Human CA150, a transcriptional activator, binds to and is co-deposited with huntingtin during Huntington's disease. The second WW domain of CA150 is a three-stranded beta-sheet that folds in vitro in microseconds and forms amyloid fibers under physiological conditions. We found from exhaustive alanine scanning studies that fibrillation of this WW domain begins from its denatured conformations, and we identified a subset of residues critical for fibril formation. We used high-resolution magic-angle-spinning NMR studies on site-specific isotopically labeled fibrils to identify abundant long-range interactions between side chains. The distribution of critical residues identified by the alanine scanning and NMR spectroscopy, along with the electron microscopy data, revealed the protofilament repeat unit: a 26-residue non-native beta-hairpin. The structure we report has similarities to the hairpin formed by the A(beta)((1-40)) protofilament, yet also contains closely packed side-chains in a "steric zipper" arrangement found in the cross-beta spine formed from small peptides from the Sup35 prion protein. Fibrillation of unrelated amyloidogenic sequences shows the common feature of zippered repeat units that act as templates for fiber elongation.
Conflict of interest statement
The authors declare no conflict of interest.
Figures
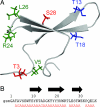
Fig. 1.
Cartoon of the structure of native CA150.WW2 [PDB ID code 1E0L (6)]. (A) Side chains that interact with each other in the fibrillar but not in the native state are marked in identical colors. (B) Sequence of CA150.WW2. The sequence is numbered according to the solution structure with the register of the native β-strands indicated by black arrows. The first three residues (gsm) originate from the expression vector and are numbered −2, −1, and 0, respectively. Flanking residues were also present in synthetic peptides used in this study. The mutations examined in this study are shown in red.
Fig. 2.
Fibrillation kinetics of CA150.WW2 variants. (A) Representative light-scattering transients for variants with fibrillation kinetics significantly different from wild-type CA150.WW2. The data shown for R24A are representative of mutants of abrogated fiber formation with no changes in light scattering observed, even after 6,000 min. (B) Denatured state population correlates with fibrillation rate. The apparent elongation time constant τ (where τ = 1/k, and k is the elongate rate) significantly correlated with the degree of native state destabilization reported (8). The solid line shows the best linear fit weighted by the standard errors determined from triplicate measurements.
Fig. 3.
Properties of CA150.WW2 aggregates formed under physiological conditions. (A) Light-scattering kinetics for CA150.WW2 peptide fragments. Peptides WT[1–8] and D15N[12–37] gave no appreciable scattering at 37°C, even after 1,600 min. In contrast, WT[1–13], D15N[1–24], and D15N[1–30] all had strong changes in light scattering, consistent with aggregation. The aggregates tested positive for amyloid fibers in thioflavin T assays (data not shown) and by EM. There was no lag phase in the aggregation kinetics for D15N[1–30], which had very low solubility. Residue 15 was changed from Asp to Asn in D15N[1–24], D15N[1–30], and D15N[12–37], because it was exceptionally difficult to synthesize these peptides with the wild-type residue. This mutation did not affect the amyloid-forming tendencies of full-length FBP28 peptides (unpublished data). (B) Negatively stained electron micrograph of the microcrystals formed by WT[1–13] peptide fragments. (C) Low-dose uranyl acetate electron micrograph of a tubular association of amyloid fibrils formed by the Y19F mutant of CA150.WW2. The frayed end of one of these tubes, comprised of ≈100 protofilaments, is evident in the lower right-hand corner of the image, as are the upper and lower face of a tube. (D) Optical diffraction pattern of a Y19F amyloid tube oriented as shown in C. The width of individual protofilaments was determined from this to be 30 Å, with a cross-β spacing of 4.73 Å. (Scale bars, 100 nm.)
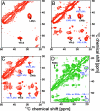
Fig. 4.
Solid-state NMR spectra of CA150.WW2 Y19F amyloid fibers recorded at 900 MHz, 10.5 kHz MAS, and 284 K. Side-chain correlations within the same amino acid are annotated in black, and cross-peaks due to interactions between side chains of different amino acids are labeled in blue. (A) 2-CA150.WW2, PDSD, 20 ms mixing. (B) 2-CA150.WW2, PDSD, 200 ms mixing. (C) 2-CA150.WW2, PDSD, 400 ms mixing. (D) 1,3-CA150.WW2, PDSD, 200 ms mixing. The appearance of extra cross-peaks in A–C with longer mixing times identifies the interactions between atoms, which are more distant than those observed using shorter mixing times.
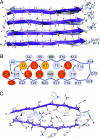
Fig. 5.
Structural model of the CA150.WW2 protofilament. (A) View of the long axis of the protofilament. The strands of the parallel β-sheet in the background (gray) were formed by residues 20–28, with residues 3–11 forming the β-sheet in the foreground (violet). Residues N-terminal to A2 and C-terminal to T29 are not shown, because they had no detectable regular structure. Each hairpin is linked to others by backbone hydrogen bonds used as constraints (dashed lines) and buried side-chain interactions (not shown). (B) Cartoon representation of the nonnative β-hairpin. The long-range interactions detected by MAS NMR and used for the structure calculations are shown by black arrows and define the interface between the β-strands. Dotted arrows indicate ambiguous distance constraints that could be fitted into the structure after the calculation. Residues that eliminated or significantly decelerated fibrillation when mutated to Ala are marked in red and orange, respectively (Table 1). We could not determine the effects of mutating W8 and N22 (light gray), because the corresponding Ala variants could not be expressed in sufficient quantities for characterization. (C) One repeat unit, viewed down the fiber axis, with colors encoding atom type. It is a hairpin formed by two β-strands of nonnative register linked by a flexible loop region between residues T13 and T18. The interface between strands is well packed and includes a salt bridge between E7 and R24. This interaction was not an intrinsic restraint in the model but a consequence of the periodicity dictated by the V5-R24, V5-L26, T13-T18, and T3-S28 interactions identified using solid-state MAS NMR. The width of the ordered region of the hairpin (T3-T13 = 31 Å) is consistent with the dimensions determined using EM (Fig. 3). Blue dotted lines represent the long-range interactions identified by MAS NMR, which were used as restraints in structure calculations; hydrogen bonds are indicated by dashed red lines.
Similar articles
- Peptide conformation and supramolecular organization in amylin fibrils: constraints from solid-state NMR.
Luca S, Yau WM, Leapman R, Tycko R. Luca S, et al. Biochemistry. 2007 Nov 27;46(47):13505-22. doi: 10.1021/bi701427q. Epub 2007 Nov 3. Biochemistry. 2007. PMID: 17979302 Free PMC article. - Steric zipper of the amyloid fibrils formed by residues 109-122 of the Syrian hamster prion protein.
Lee SW, Mou Y, Lin SY, Chou FC, Tseng WH, Chen CH, Lu CY, Yu SS, Chan JC. Lee SW, et al. J Mol Biol. 2008 May 16;378(5):1142-54. doi: 10.1016/j.jmb.2008.03.035. Epub 2008 Mar 26. J Mol Biol. 2008. PMID: 18423487 - Structural insights into the polymorphism of amyloid-like fibrils formed by region 20-29 of amylin revealed by solid-state NMR and X-ray fiber diffraction.
Madine J, Jack E, Stockley PG, Radford SE, Serpell LC, Middleton DA. Madine J, et al. J Am Chem Soc. 2008 Nov 12;130(45):14990-5001. doi: 10.1021/ja802483d. Epub 2008 Oct 21. J Am Chem Soc. 2008. PMID: 18937465 - Molecular structures of amyloid and prion fibrils: consensus versus controversy.
Tycko R, Wickner RB. Tycko R, et al. Acc Chem Res. 2013 Jul 16;46(7):1487-96. doi: 10.1021/ar300282r. Epub 2013 Jan 7. Acc Chem Res. 2013. PMID: 23294335 Free PMC article. Review. - Molecular structure of amyloid fibrils: insights from solid-state NMR.
Tycko R. Tycko R. Q Rev Biophys. 2006 Feb;39(1):1-55. doi: 10.1017/S0033583506004173. Epub 2006 Jun 13. Q Rev Biophys. 2006. PMID: 16772049 Review.
Cited by
- Folding versus aggregation: polypeptide conformations on competing pathways.
Jahn TR, Radford SE. Jahn TR, et al. Arch Biochem Biophys. 2008 Jan 1;469(1):100-17. doi: 10.1016/j.abb.2007.05.015. Epub 2007 Jun 8. Arch Biochem Biophys. 2008. PMID: 17588526 Free PMC article. Review. - Computational simulations of the early steps of protein aggregation.
Wei G, Mousseau N, Derreumaux P. Wei G, et al. Prion. 2007 Jan-Mar;1(1):3-8. doi: 10.4161/pri.1.1.3969. Epub 2007 Jan 5. Prion. 2007. PMID: 19164927 Free PMC article. Review. - Structural motifs of biomolecules.
Banavar JR, Hoang TX, Maddocks JH, Maritan A, Poletto C, Stasiak A, Trovato A. Banavar JR, et al. Proc Natl Acad Sci U S A. 2007 Oct 30;104(44):17283-6. doi: 10.1073/pnas.0704594104. Epub 2007 Oct 24. Proc Natl Acad Sci U S A. 2007. PMID: 17959779 Free PMC article. - Polymorphism in Alzheimer Abeta amyloid organization reflects conformational selection in a rugged energy landscape.
Miller Y, Ma B, Nussinov R. Miller Y, et al. Chem Rev. 2010 Aug 11;110(8):4820-38. doi: 10.1021/cr900377t. Chem Rev. 2010. PMID: 20402519 Free PMC article. Review. No abstract available. - Truncated beta-amyloid peptide channels provide an alternative mechanism for Alzheimer's Disease and Down syndrome.
Jang H, Arce FT, Ramachandran S, Capone R, Azimova R, Kagan BL, Nussinov R, Lal R. Jang H, et al. Proc Natl Acad Sci U S A. 2010 Apr 6;107(14):6538-43. doi: 10.1073/pnas.0914251107. Epub 2010 Mar 22. Proc Natl Acad Sci U S A. 2010. PMID: 20308552 Free PMC article.
References
- Jahn TR, Radford SE. FEBS J. 2005;272:5962–5970. - PubMed
Publication types
MeSH terms
Substances
LinkOut - more resources
Full Text Sources
Molecular Biology Databases


