Functional genomic analysis of oligodendrocyte differentiation - PubMed (original) (raw)
Comparative Study
Functional genomic analysis of oligodendrocyte differentiation
Jason C Dugas et al. J Neurosci. 2006.
Abstract
To better understand the molecular mechanisms governing oligodendrocyte (OL) differentiation, we have used gene profiling to quantitatively analyze gene expression in synchronously differentiating OLs generated from pure oligodendrocyte precursor cells in vitro. By comparing gene expression in these OLs to OLs generated in vivo, we discovered that the program of OL differentiation can progress normally in the absence of heterologous cell-cell interactions. In addition, we found that OL differentiation was unexpectedly prolonged and occurred in at least two sequential stages, each characterized by changes in distinct complements of transcription factors and myelin proteins. By disrupting the normal dynamic expression patterns of transcription factors regulated during OL differentiation, we demonstrated that these sequential stages of gene expression can be independently controlled. We also uncovered several genes previously uncharacterized in OLs that encode transmembrane, secreted, and cytoskeletal proteins that are as highly upregulated as myelin genes during OL differentiation. Last, by comparing genomic loci associated with inherited increased risk of multiple sclerosis (MS) to genes regulated during OL differentiation, we identified several new positional candidate genes that may contribute to MS susceptibility. These findings reveal a previously unexpected complexity to OL differentiation and suggest that an intrinsic program governs successive phases of OL differentiation as these cells extend and align their processes, ensheathe, and ultimately myelinate axons.
Figures
Figure 1.
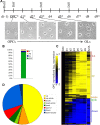
Expression patterns of genes regulated during OL differentiation. A, OPCs purified from P7 rat brains were plated into proliferation medium (prolif) in several parallel dishes. At 24 h after plating (day 0, “OPC”), cultures were switched entirely into differentiation medium (diff). Remaining cells were fed differentiation medium at days 4 and 7. Asterisks (*) correspond to time points at which RNA samples were collected; the “OPC” sample was taken from cells never exposed to differentiation medium. Below the time line are phase contrast pictures of cultured OPCs as they differentiate into OLs at indicated time points. No additional morphological changes are seen past day 5 in differentiation medium. B, The purity of the initial OPC cultures was assessed after 24 h in proliferation medium. Cultures were stained for NG2 (OPC, 91.3%), GC (OL, 4.5%), GFAP [astrocytes (AS), 3.4%], and neurofilament [neurons (N), 0.7%]. Note that only the NG2+ cells appeared fully healthy at this time point (data not shown). C, Expression patterns of the 953 selected highly regulated Affymetrix probe sets. Each horizontal line in the figure corresponds to one selected probe set, with average expression levels at each of the indicated time points illustrated in the eight corresponding columns; AcOL, acutely purified OL. For each probe set, expression values depicted are changes relative to the starting average OPC expression level, expressed on a log2 scale. All changes ≥4× up (≥log2 2) are strongest yellow, and all changes ≥4× down (≤log2 −2) are strongest blue. Gene expression patterns were grouped using the average hierarchical clustering method with a Pearson correlation as the distance metric in GeneTraffic (Stratagene); similar expression patterns are labeled: probable type 2 astrocyte in red, upregulated in yellow, strongly upregulated only in acutely purified OLs in orange, early expression peak followed by downregulation in green, and downregulation in blue. D, Cumulative expression pattern frequency for the selected regulated probe sets. Individual probe set expression patterns are listed in supplemental Table S2 (available at
as supplemental material). Here, “down” also includes probe sets that appear transiently downregulated but also lower in acute OL samples (“dip-down” on supplemental Table S2, available at
as supplemental material), and “peak” includes probe sets that peak and then drop to levels lower than OPCs (“peak-down” on supplemental Table S2, available at
as supplemental material). The percentages for each expression pattern are as follows: up, 45.12%; up-acute, 8.18%; acute, 0.73%; peak-acute, 3.04%; peak, 4.93%; type 2, 7.66%; down, 27.6%; down-acute, 2.73%.
Figure 2.
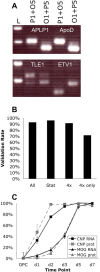
Verification of gene expression time courses. A, Verification of genomic expression data by comparative RT-PCR. The four examples shown are APLP1, ApoD, TLE1, and ETV1. The two comparative RT-PCRs for each gene are as follows: acute OPC–10 bp tag plus acute OL–50 bp tag (P1+O5; OL level upper band) and acute OL–10 bp tag plus acute OPC–50 bp tag (O1+P5; OL expression lower band); upregulated genes have stronger OL sample bands. L, 100 bp DNA ladder. B, Cumulative comparative RT-PCR verification rates for tested genes. A gene was considered “verified” if its expression was qualitatively similar in both the gene chip and RT-PCR data (e.g., both showing higher levels in OLs relative to OPCs). A total of 51 of 55 selected Affymetrix probe sets was independently verified (all), including 37 of 40 tested transcription factor genes listed in supplemental Table S6 (available at
as supplemental material); verification rates were 46 of 48 for probe sets identified by statistical analysis (stat) and 42 of 46 for probe sets changing ≥4× relative to OPC levels (4×). Among probe sets selected only by fourfold changes (not statistically selected; 4× only), 5 of 7 tested probe sets were verified. C, Comparison of protein expression and gene expression time courses. Average CNP1 (L16532_at; black squares) and MOG (M99485_at; black triangles) RNA expression levels from Affymetrix at various time points during OL differentiation; expression levels relative to OPC levels expressed on a log2 scale, shown as percentages of maximal day 7 expression levels. To assay protein expression, purified P7 OPCs were cultured as depicted in Figure 1_A_. The percentages of healthy cells strongly expressing CNP1 (gray squares) and MOG (gray triangles) were assayed by immunostaining at the time points indicated. All data points are presented ±SEM (n = 4 for RNA; n = 3 for protein).
Figure 3.
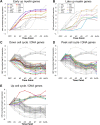
Temporal expression patterns of regulated myelin and cell cycle control/DNA replication genes. A, B, Myelin-enriched genes are induced in two distinct phases during OL differentiation (supplemental Table S3, available at
as supplemental material). A, Genes induced immediately after PDGF/NT3 withdrawal and T3 exposure are highlighted in color (OSP, MBP, UGT8, CNP1, PLP), with late-induced myelin-related genes shown in gray. B, Genes whose induction is delayed after PDGF/NT3 withdrawal and T3 exposure are highlighted in color (Tm4sf11, Tspan2, MOG, MAG, ASPA, MOBP, MAL). C–E, Expression patterns of all regulated cell cycle/DNA replication genes (supplemental Table S7, available at
as supplemental material). C, Genes repressed soon after PDGF/NT3 withdrawal and T3 exposure are highlighted in color, with remaining genes shown in gray. D, Genes that immediately peak and are subsequently downregulated after PDGF/NT3 withdrawal and T3 exposure are highlighted in color. E, Genes induced after PDGF/NT3 withdrawal and T3 exposure are highlighted in color. In all graphs, expression levels are determined as average fold changes relative to average OPC levels and expressed on a log2 scale at the time points indicated. AcOL, Acutely purified OL sample.
Figure 4.
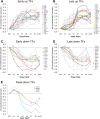
Temporal expression patterns of regulated transcription factor genes. A, B, Transcription factor genes induced during OL differentiation (supplemental Table S6, available at
as supplemental material). A, Genes induced immediately after PDGF/NT3 withdrawal and T3 exposure are highlighted in color (KLF9, MLR1, EPAS1, ELF1, LITAF, TSC22d4, CARHSP1), with later-induced genes shown in gray. B, Genes whose induction is delayed for 2–3 d after PDGF/NT3 withdrawal and T3 exposure are highlighted in color (ZFP536, CSRP1, PCAF, KUA, APLP1, APP, CREB3L2, EYA4, KLF13, RILP, TLE1). C, D, Transcription factors repressed during OL differentiation. C, Genes repressed immediately after PDGF/NT3 withdrawal and T3 exposure are highlighted in color (FOSL2, CITED2, CEBPB, HMGA2, GCF2, EGR1, HMGA1). D, Genes whose downregulation is delayed after PDGF/NT3 withdrawal and T3 exposure are highlighted in color (DAT1, SOX11, ETV5, DNMT1, MYT1, ETV1). E, Transcription factors that immediately peak and are later repressed after PDGF/NT3 withdrawal and T3 exposure (TRIP13, HMGB2, HMGB3, UHRF1) are plotted. In all graphs, expression levels are determined as average fold changes relative to average OPC levels and expressed on a log2 scale at the time points indicated. AcOL, Acutely purified OL sample; TF, transcription factor.
Figure 5.
Distinct stages of OL differentiation are differentially regulated. A–E, Cultured OPCs were transfected with a CMV-eGFP expression vector alone (C), or with either a pool of nontargeting siRNAs (A), siRNAs targeting rat SOX10 (B), siRNAs targeting rat ZFP536 (D), or a CMV-UHRF1 overexpression plasmid (E). Transfected OPCs were then cultured in medium lacking OPC mitogens (no PDGF or NT-3) to promote differentiation for 4 d in vitro, after which cells were costained for GFP expression to mark transfected cells (A1–E1) and either MBP (A2–B2) or MOG (C2–E2) expression to assay the levels of early (MBP) or late (MOG) induced myelin gene expression. The yellow arrows denote transfected cells (GFP+) expressing indicated markers (MBP or MOG), the green arrows indicate transfected cells not expressing indicated markers, and the red arrows denote untransfected cells (GFP−) expressing indicated markers. DAPI, 4′,6′-Diamidino-2-phenylindole. F, Effects of individual transcription factor knock-down or overexpression on MBP and MOG expression in transfected OLs; control, CMV-eGFP vector only or CMV-eGFP plus nontargeting siRNAs. The percentage of GFP+ cells positive for early (MBP) or late (MOG) myelin gene expression was assessed for each condition. Data were normalized to control levels of MBP or MOG expression. Average control MBP+ cells, 83.8%, MOG+ cells, 60.2%. All control-normalized data were averaged and presented ±SEM; control-MBP, n = 15; siSOX10-MBP, n = 9; siZFP536-MBP, n = 3; CMV-UHRF1-MBP, n = 3; control-MOG, n = 15; siSOX10-MOG, n = 6; siZFP536, n = 3; CMV-UHRF1-MOG, n = 6. *p < 0.01, post hoc Holm–Sidak test compared with control.
Figure 6.
Functional characterization of genes regulated during OL differentiation. Each unique gene on our list of selected regulated Affymetrix probe sets (supplemental Table S2, available at
as supplemental material) was assigned to one or more of the biological functional groups listed. Multiple probe sets recognizing the same gene were categorized only once; some single genes are assigned to more than one functional group. A, Functional category frequency of genes regulated during OL differentiation, excluding likely type 2 astrocyte (2A) genes. Notes on categories: ion transport includes ion channels; myelin, genes enriched in myelin sheaths; membrane, membrane synthesis and trafficking; ecm, extracellular matrix component; dna repl/repair, DNA replication or repair; rna processing includes RNA splicing genes; est, unknown ESTs and genes of unknown function. B, Functional characterization of selected regulated genes grouped by expression pattern. All-2A: All regulated genes excluding probable 2A genes; up: up, up-acute, and acute patterns; acute: acute and up-acute patterns; down: down and dip-down patterns; peak: peak and peak-down patterns; pk-ac: peak-acute and peak-down-acute patterns; 2A: probable type 2 astrocyte pattern.
Similar articles
- Dicer1 and miR-219 Are required for normal oligodendrocyte differentiation and myelination.
Dugas JC, Cuellar TL, Scholze A, Ason B, Ibrahim A, Emery B, Zamanian JL, Foo LC, McManus MT, Barres BA. Dugas JC, et al. Neuron. 2010 Mar 11;65(5):597-611. doi: 10.1016/j.neuron.2010.01.027. Neuron. 2010. PMID: 20223197 Free PMC article. - MicroRNA expression profiling of oligodendrocyte differentiation from human embryonic stem cells.
Letzen BS, Liu C, Thakor NV, Gearhart JD, All AH, Kerr CL. Letzen BS, et al. PLoS One. 2010 May 5;5(5):e10480. doi: 10.1371/journal.pone.0010480. PLoS One. 2010. PMID: 20463920 Free PMC article. - PPAR delta agonists stimulate oligodendrocyte differentiation in tissue culture.
Saluja I, Granneman JG, Skoff RP. Saluja I, et al. Glia. 2001 Mar 1;33(3):191-204. Glia. 2001. PMID: 11241737 - MicroRNA: Key regulators of oligodendrocyte development and pathobiology.
Fitzpatrick JM, Anderson RC, McDermott KW. Fitzpatrick JM, et al. Int J Biochem Cell Biol. 2015 Aug;65:134-8. doi: 10.1016/j.biocel.2015.05.021. Epub 2015 May 27. Int J Biochem Cell Biol. 2015. PMID: 26026282 Review. - Two-tier transcriptional control of oligodendrocyte differentiation.
Li H, He Y, Richardson WD, Casaccia P. Li H, et al. Curr Opin Neurobiol. 2009 Oct;19(5):479-85. doi: 10.1016/j.conb.2009.08.004. Epub 2009 Sep 7. Curr Opin Neurobiol. 2009. PMID: 19740649 Free PMC article. Review.
Cited by
- High Mobility Group A1 Regulates Transcription Levels of Oligodendrocyte Marker Genes in Cultured Oligodendrocyte Precursor Cells.
Egawa N, Hamanaka G, Chung KK, Ishikawa H, Shindo A, Maki T, Takahashi R, Inoue H, Lo EH, Arai K. Egawa N, et al. Int J Mol Sci. 2022 Feb 17;23(4):2236. doi: 10.3390/ijms23042236. Int J Mol Sci. 2022. PMID: 35216347 Free PMC article. - Pyramidal neurons are generated from oligodendroglial progenitor cells in adult piriform cortex.
Guo F, Maeda Y, Ma J, Xu J, Horiuchi M, Miers L, Vaccarino F, Pleasure D. Guo F, et al. J Neurosci. 2010 Sep 8;30(36):12036-49. doi: 10.1523/JNEUROSCI.1360-10.2010. J Neurosci. 2010. PMID: 20826667 Free PMC article. - Astrocyte ensheathment of calyx-forming axons of the auditory brainstem precedes accelerated expression of myelin genes and myelination by oligodendrocytes.
Heller DT, Kolson DR, Brandebura AN, Amick EM, Wan J, Ramadan J, Holcomb PS, Liu S, Deerinck TJ, Ellisman MH, Qian J, Mathers PH, Spirou GA. Heller DT, et al. J Comp Neurol. 2024 Feb;532(2):e25552. doi: 10.1002/cne.25552. Epub 2023 Nov 2. J Comp Neurol. 2024. PMID: 37916792 - A tool for examining the role of the zinc finger myelin transcription factor 1 (Myt1) in neural development: Myt1 knock-in mice.
Hudson LD, Romm E, Berndt JA, Nielsen JA. Hudson LD, et al. Transgenic Res. 2011 Aug;20(4):951-61. doi: 10.1007/s11248-010-9470-x. Epub 2011 Jan 26. Transgenic Res. 2011. PMID: 21267777 Free PMC article. - Protocol to isolate a large amount of functional oligodendrocyte precursor cells from the cerebral cortex of adult mice and humans.
Medina-Rodríguez EM, Arenzana FJ, Bribián A, de Castro F. Medina-Rodríguez EM, et al. PLoS One. 2013 Nov 26;8(11):e81620. doi: 10.1371/journal.pone.0081620. eCollection 2013. PLoS One. 2013. PMID: 24303061 Free PMC article.
References
- Arima Y, Hirota T, Bronner C, Mousli M, Fujiwara T, Niwa S, Ishikawa H, Saya H. Down-regulation of nuclear protein ICBP90 by p53/p21Cip1/WAF1-dependent DNA-damage checkpoint signals contributes to cell cycle arrest at G1/S transition. Genes Cells. 2004;9:131–142. - PubMed
- Barres BA, Hart IK, Coles HS, Burne JF, Voyvodic JT, Richardson WD, Raff MC. Cell death and control of cell survival in the oligodendrocyte lineage. Cell. 1992;70:31–46. - PubMed
- Barres BA, Schmid R, Sendnter M, Raff MC. Multiple extracellular signals are required for long-term oligodendrocyte survival. Development. 1993;118:283–295. - PubMed
Publication types
MeSH terms
Substances
Grants and funding
- R01 LM007609/LM/NLM NIH HHS/United States
- R01 LM07609-01/LM/NLM NIH HHS/United States
- R01 DC007235/DC/NIDCD NIH HHS/United States
- HG0047/HG/NHGRI NIH HHS/United States
- R01 EY010257/EY/NEI NIH HHS/United States
- R01 HD061665/HD/NICHD NIH HHS/United States
- K22 HG000047/HG/NHGRI NIH HHS/United States
- T32 HG000047/HG/NHGRI NIH HHS/United States
- R01 EY10257/EY/NEI NIH HHS/United States
- R01 MH61665/MH/NIMH NIH HHS/United States
LinkOut - more resources
Full Text Sources
Other Literature Sources
Molecular Biology Databases


