Phosphoinositide 3-kinase binds to TRPV1 and mediates NGF-stimulated TRPV1 trafficking to the plasma membrane - PubMed (original) (raw)
Phosphoinositide 3-kinase binds to TRPV1 and mediates NGF-stimulated TRPV1 trafficking to the plasma membrane
Alexander T Stein et al. J Gen Physiol. 2006 Nov.
Abstract
Sensitization of the pain-transducing ion channel TRPV1 underlies thermal hyperalgesia by proalgesic agents such as nerve growth factor (NGF). The currently accepted model is that the NGF-mediated increase in TRPV1 function during hyperalgesia utilizes activation of phospholipase C (PLC) to cleave PIP2, proposed to tonically inhibit TRPV1. In this study, we tested the PLC model and found two lines of evidence that directly challenge its validity: (1) polylysine, a cationic phosphoinositide sequestering agent, inhibited TRPV1 instead of potentiating it, and (2) direct application of PIP2 to inside-out excised patches dramatically potentiated TRPV1. Furthermore, we show four types of experiments indicating that PI3K is physically and functionally coupled to TRPV1: (1) the p85beta subunit of PI3K interacted with the N-terminal region of TRPV1 in yeast 2-hybrid experiments, (2) PI3K-p85beta coimmunoprecipitated with TRPV1 from both HEK293 cells and dorsal root ganglia (DRG) neurons, (3) TRPV1 interacted with recombinant PI3K-p85 in vitro, and (4) wortmannin, a specific inhibitor of PI3K, completely abolished NGF-mediated sensitization in acutely dissociated DRG neurons. Finally, simultaneous electrophysiological and total internal reflection fluorescence (TIRF) microscopy recordings demonstrate that NGF increased the number of channels in the plasma membrane. We propose a new model for NGF-mediated hyperalgesia in which physical coupling of TRPV1 and PI3K in a signal transduction complex facilitates trafficking of TRPV1 to the plasma membrane.
Figures
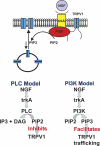
Figure 1.
Mechanism of NGF-mediated sensitization. Simplified cartoon representation of the TRPV1-PI3K-trkA signal transduction complex (above) and two models of NGF-mediated sensitization (below). The PIP2 headgroups are shown in green and the PIP3 headgroups are shown in pink.
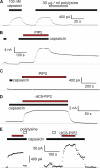
Figure 2.
PIP2 is a potentiating molecule for TRPV1, not an inhibitory molecule. (A) Excised inside-out membrane patches were pulled from F-11 cells transfected with TRPV1. Points are steady-state currents recorded during a 100-ms pulse to +80 mV (positive inside relative to outside) from a holding potential of 0 mV. Zero current is indicated by the dotted line. Capsaicin and polylysine (>300 kD) were applied for the duration of the bars. We chose 30 μg/ml polylysine because it has recently been shown to be effective in sequestering PIP2 from TRPM4 channels (Zhang et al., 2005b). Inhibition by polylysine did not spontaneously reverse over the time scale of our experiments, suggesting that its unbinding from the PIP2 is quite slow. (B) Currents and cells as in A. PIP2 (10 μM) and capsaicin were applied during the time of the bar. The delay observed between PIP2 application and the increase in current arose from the special system we devised to apply very small amounts of the expensive phosphoinositide to our cell chamber (see Materials and methods). (C) Application of PIP2 to an untransfected F-11 cell. (D) Water-soluble DiC8-PIP2 (red bar) reversibly potentiated capsaicin-activated current. Inside-out excised patch from F-11 cell transfected with TRPV1. (E) Two representative inside-out patches from mouse DRG neurons. The open and filled black bars as above. The red bar represents DiC8-PIP2. The time scale bar applies to both panels, but each has its own scale bar for current.
Figure 3.
Ruthenium red (RR) and capsazepine (CPZ) reduce the amplitude of PIP2-potentiated currents. (A) Currents from inside-out excised patches in which the membrane was held and 0 mV and the potential was jumped to +80 mV, to −80 mV, and back to 0 mV. Note that RR is believed to be a voltage-dependent blocker of the pore, and thus is less effective at hyperpolarized potentials. In contrast, CPZ may allosterically inhibit activation, giving similar reductions in current at depolarized and hyperpolarized potentials. RR (blue, top) and CPZ (red, bottom) were applied to different patches. (B) Box plot showing the percent reduction in current at +80 mV for RR and CPZ. For comparison, the percent inhibition of capsaicin-activated currents by RR in the absence of PIP2 is shown (first box). Boxes enclose the 25th to 75th percentile of the data, lines within the boxes represent the median, and whiskers extend to the 10th and 90th percentiles.
Figure 4.
Coimmunoprecipitation between TRPV1 and PI3K-p85β. (A) Immunoprecipitation from HEK293 cells transfected with either TRPV1-FLAG or TRPV1, as a negative control. Proteins were immunoprecipitated with the indicated antibodies, and blots were probed with anti–PI3K-p85β antibody. (B) Immunoprecipitation from mouse DRG cells. Proteins were immunoprecipitated with anti–PI3K-p85β, and blot was probed with anti-TRPV1 antibody.
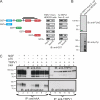
Figure 5.
TRPV1 binds to the PI3K SH2 domains in a phosphotyrosine-independent manner. (A) In vitro interaction assay using TRPV1-FLAG from HEK293 cells (left) or recombinant N terminus of TRPV1 from bacteria with a FLAG epitope at its C-terminal end (right). FLAG-tagged TRPV1 protein was immobilized on anti-FLAG agarose beads, and recombinant GST fusion proteins corresponding to PI3K-p85α were tested for interaction. The bars in the cartoon represent the two independent clones of PI3K-p85β identified in the yeast 2-hybrid assay. For the Western blot, equivalent amounts of input and bound proteins were probed with anti-GST antibody. (B) The recombinant N-terminal protein was not tyrosine phosphorylated. The recombinant FLAG-tagged protein was run in the left lane, and lysates from trkA-transfected HEK293 cells were run in the right lane. Duplicate gels were run, and Western blot analysis was then performed with either the anti-FLAG antibody (top) or the anti-phosphotyrosine antibody (bottom). (C) TRPV1 in HEK293 cells was not tyrosine phosphorylated. HEK293 cells expressing combinations of TRPV1, p75, and trkA, as indicated in the figure, were treated with either NGF or vehicle and then immunoprecipitated with anti-trkA (lanes 1–7) or anti-TRPV1 (lanes 8–13) antibodies. Lanes 1–7 were separated from lanes 8–13 and the membranes were probed with anti-trkA antibody and anti-TRPV1 antibody, respectively (top). Segments of the membrane were then reapposed for imaging. The membranes were then stripped and reprobed with anti-phosphotyrosine antibody (bottom).
Figure 6.
Wortmannin inhibits NGF-mediated sensitization of TRPV1. (A–C) Perforated patch recordings from acutely dissociated mouse DRG neurons activated with 25 nM capsaicin and held at −80 mV. Either (A) no drug, (B) 100 ng/ml NGF, or (C) NGF plus 20 nM wortmannin (WMN) were applied for 10 min. (D) The ratio of final current to initial current for the three conditions. The mean is shown as a horizontal line. The median for these cells was 1.16, 2.99, and 1.05 for control, NGF, and NGF + WMN, respectively.
Figure 7.
NGF increases the maximum current but not the EC50 for capsaicin. (A) Whole cell currents from acutely dissociated mouse DRG neurons in response to various concentrations of capsaicin before and after a 10-min treatment with 100 ng/ml NGF. (B) Dose–response relation for cell in A. Solid curves are fits with the Hill equation, with a slope of 3. (C) Ratio of maximal currents after 10 min NGF treatment or 10 min control treatment. Asterisk represents a statistically significant difference compared with control. (Imaxpost-NGF/ImaxpreNGF = 1.28 ± 0.22; n = 10).
Figure 8.
NGF increases the number of functional TRPV1 channels and does not change the channel open probability or unitary conductance. (A) Currents recorded in perforated patch whole cell voltage clamp (−80 mV) were recorded from DRG neurons while they were perfused with saturating capsaicin before (black) and after (red) treatment with NGF (100 ng/ml, 10 min). (B) Smoothed functions of the mean were subtracted from the raw current traces, generating a plot of variance versus time (C). The variance was calculated for segments of data, with the length of the segments reduced until the variance reached a minimum. The variance was plotted versus the smoothed function of the mean and fitted with the equation f(x) = _x_i − (x 2)/N using a least squares algorithm. (D) The fits revealed an increase in the number of functional channels (N) after NGF, but no difference in i. The absolute value of N was calculated to be 1782 before NGF and 2577 after NGF treatment. The Po was calculated from the capsaicin response current with the equation Po = I/(Ni). The Po in saturating capsaicin was not found to have been affected by NGF.
Figure 9.
NGF increased the number of channels in the plasma membrane. TIRF images and perforated patch whole cell voltage clamp currents from F-11 cells transfected with TRPV1-eYFP, trkA, and p75. (A) The fluorescence in the plasma membrane is not altered under control conditions. TIRF images taken from a representative cell immediately after attaining maximum perforation (left), during the addition of capsaicin (100 nM; center), and during a second exposure to capsaicin (right), which followed a 10-min perfusion with vehicle (no NGF). (B) Time course of the spatially averaged fluorescence intensity from control experiments (no NGF). Fluorescence values were normalized to the initial mean fluorescence intensity of each cell. The data represent mean ± SEM from five independent experiments. (C) Fluorescence in the plasma membrane increases in response to NGF. TIRF images from a typical F-11 cell after patching (left), during superfusion of capsaicin (center), and during superfusion of capsaicin after stimulation with 100 ng/ml NGF (right) for 10 min. Note that the only difference between the protocol shown on C and A was the addition of NGF. The capsaicin-activated currents correspond to the imaged cell, before (black trace) and after (red trace) NGF treatment. (D) Bar plot of the normalized membrane fluorescence before (white bar) and after (red bar) a 10-min NGF treatment (100 ng/ml). The white bar represents the fluorescence intensity observed during the first capsaicin response (before NGF) normalized to the initial fluorescence. The asterisk represents a statistically significant difference (P < 0.05) compared with capsaicin-induced changes pre-NGF treatment (Ffinal/Finitial pre-NGF = 0.98 ± 0.03, Ffinal/Finitial post-NGF = 1.31 ± 0.11; n = 5).
Comment in
- Why pain gets worse: the mechanism of heat hyperalgesia.
Zhang X, McNaughton PA. Zhang X, et al. J Gen Physiol. 2006 Nov;128(5):491-3. doi: 10.1085/jgp.200609676. J Gen Physiol. 2006. PMID: 17074974 Free PMC article. No abstract available.
Similar articles
- Phosphatidylinositol 3-kinase activates ERK in primary sensory neurons and mediates inflammatory heat hyperalgesia through TRPV1 sensitization.
Zhuang ZY, Xu H, Clapham DE, Ji RR. Zhuang ZY, et al. J Neurosci. 2004 Sep 22;24(38):8300-9. doi: 10.1523/JNEUROSCI.2893-04.2004. J Neurosci. 2004. PMID: 15385613 Free PMC article. - Regulation of transient receptor potential cation channel subfamily V1 protein synthesis by the phosphoinositide 3-kinase/Akt pathway in colonic hypersensitivity.
Shen S, Al-Thumairy HW, Hashmi F, Qiao LY. Shen S, et al. Exp Neurol. 2017 Sep;295:104-115. doi: 10.1016/j.expneurol.2017.06.007. Epub 2017 Jun 3. Exp Neurol. 2017. PMID: 28587873 Free PMC article. - Phosphoinositide-3-kinase and mitogen activated protein kinase signaling pathways mediate acute NGF sensitization of TRPV1.
Zhu W, Oxford GS. Zhu W, et al. Mol Cell Neurosci. 2007 Apr;34(4):689-700. doi: 10.1016/j.mcn.2007.01.005. Epub 2007 Jan 24. Mol Cell Neurosci. 2007. PMID: 17324588 Free PMC article. - Phospholipase C mediated modulation of TRPV1 channels.
Rohacs T, Thyagarajan B, Lukacs V. Rohacs T, et al. Mol Neurobiol. 2008 Apr-Jun;37(2-3):153-63. doi: 10.1007/s12035-008-8027-y. Epub 2008 Jun 5. Mol Neurobiol. 2008. PMID: 18528787 Free PMC article. Review. - Functional aspects and mechanisms of TRPV1 involvement in neurogenic inflammation that leads to thermal hyperalgesia.
Planells-Cases R, Garcìa-Sanz N, Morenilla-Palao C, Ferrer-Montiel A. Planells-Cases R, et al. Pflugers Arch. 2005 Oct;451(1):151-9. doi: 10.1007/s00424-005-1423-5. Epub 2005 May 21. Pflugers Arch. 2005. PMID: 15909179 Review.
Cited by
- The role of endogenous molecules in modulating pain through transient receptor potential vanilloid 1 (TRPV1).
Morales-Lázaro SL, Simon SA, Rosenbaum T. Morales-Lázaro SL, et al. J Physiol. 2013 Jul 1;591(13):3109-21. doi: 10.1113/jphysiol.2013.251751. Epub 2013 Apr 22. J Physiol. 2013. PMID: 23613529 Free PMC article. Review. - CB1 cannabinoid receptor agonist prevents NGF-induced sensitization of TRPV1 in sensory neurons.
McDowell TS, Wang ZY, Singh R, Bjorling D. McDowell TS, et al. Neurosci Lett. 2013 Sep 13;551:34-8. doi: 10.1016/j.neulet.2013.06.066. Epub 2013 Jul 12. Neurosci Lett. 2013. PMID: 23850608 Free PMC article. - Moving towards supraspinal TRPV1 receptors for chronic pain relief.
Palazzo E, Luongo L, de Novellis V, Berrino L, Rossi F, Maione S. Palazzo E, et al. Mol Pain. 2010 Oct 11;6:66. doi: 10.1186/1744-8069-6-66. Mol Pain. 2010. PMID: 20937102 Free PMC article. Review. - Near-membrane dynamics and capture of TRPM8 channels within transient confinement domains.
Veliz LA, Toro CA, Vivar JP, Arias LA, Villegas J, Castro MA, Brauchi S. Veliz LA, et al. PLoS One. 2010 Oct 11;5(10):e13290. doi: 10.1371/journal.pone.0013290. PLoS One. 2010. PMID: 20948964 Free PMC article. - From chills to chilis: mechanisms for thermosensation and chemesthesis via thermoTRPs.
Bandell M, Macpherson LJ, Patapoutian A. Bandell M, et al. Curr Opin Neurobiol. 2007 Aug;17(4):490-7. doi: 10.1016/j.conb.2007.07.014. Epub 2007 Aug 13. Curr Opin Neurobiol. 2007. PMID: 17706410 Free PMC article. Review.
References
- Axelrod, D. 2001. Total internal reflection fluorescence microscopy in cell biology. Traffic. 2:764–774. - PubMed
- Bezzerides, V.J., I.S. Ramsey, S. Kotecha, A. Greka, and D.E. Clapham. 2004. Rapid vesicular translocation and insertion of TRP channels. Nat. Cell. Biol. 6:709–720. - PubMed
- Bhave, G., H.J. Hu, K.S. Glauner, W. Zhu, H. Wang, D.J. Brasier, G.S. Oxford, and R.W. Gereau IV. 2003. Protein kinase C phosphorylation sensitizes but does not activate the capsaicin receptor transient receptor potential vanilloid 1 (TRPV1). Proc. of Natl. Acad. Sci. USA. 100:12480–12485. - PMC - PubMed
- Bolcskei, K., Z. Helyes, A. Szabo, K. Sandor, K. Elekes, J. Nemeth, R. Almasi, E. Pinter, G. Petho, and J. Szolcsanyi. 2005. Investigation of the role of TRPV1 receptors in acute and chronic nociceptive processes using gene-deficient mice. Pain. 117:368–376. - PubMed
Publication types
MeSH terms
Substances
Grants and funding
- R01 HL085870/HL/NHLBI NIH HHS/United States
- R01 EY017564/EY/NEI NIH HHS/United States
- R01 EY013007/EY/NEI NIH HHS/United States
- EY017564/EY/NEI NIH HHS/United States
- HL077115/HL/NHLBI NIH HHS/United States
- R01 HL077115/HL/NHLBI NIH HHS/United States
- EY013007/EY/NEI NIH HHS/United States
- T32 NS007332/NS/NINDS NIH HHS/United States
- NS07332/NS/NINDS NIH HHS/United States
LinkOut - more resources
Full Text Sources
Other Literature Sources
Molecular Biology Databases


