Assessing the influence of scanner background noise on auditory processing. I. An fMRI study comparing three experimental designs with varying degrees of scanner noise - PubMed (original) (raw)
Comparative Study
Assessing the influence of scanner background noise on auditory processing. I. An fMRI study comparing three experimental designs with varying degrees of scanner noise
Nadine Gaab et al. Hum Brain Mapp. 2007 Aug.
Abstract
We compared two experimental designs aimed at minimizing the influence of scanner background noise (SBN) on functional MRI (fMRI) of auditory processes with one conventional fMRI design. Ten subjects listened to a series of four one-syllable words and had to decide whether two of the words were identical. This was contrasted with a no-stimulus control condition. All three experimental designs had a duration of approximately 17 min: 1) a behavior interleaved gradients (BIG; Eden et al. [1999] J Magn Reson Imaging 41:13-20) design (repetition time, TR, = 6 s), where stimuli were presented during the SBN-free periods between clustered volume acquisitions (CVA); 2) a sparse temporal sampling technique (STsamp; e.g., Gaab et al., [2003] Neuroimage 19:1417-1426) acquiring only one set of slices following each of the stimulations with a 16-s TR and jittered delay times between stimulus offset and image acquisition; and 3) an event-related design with continuous scanning (ERcont) using the stimulation design of STsamp but with a 2-s TR. The results demonstrated increased signal within Heschl's gyrus for the STsamp and BIG-CVA design in comparison to ERcont as well as differences in the overall functional anatomy among the designs. The possibility to obtain a time course of activation as well as the full recovery of the stimulus- and SBN-induced hemodynamic response function signal and lack of signal suppression from SBN during the STsamp design makes this technique a powerful approach for conducting auditory experiments using fMRI. Practical strengths and limitations of the three auditory acquisition paradigms are discussed.
We compared two experimental designs aimed at minimizing the influence of scanner background noise (SBN) on functional MRI (fMRI) of auditory processes with one conventional fMRI design. Ten subjects listened to a series of four one‐syllable words and had to decide whether two of the words were identical. This was contrasted with a no‐stimulus control condition. All three experimental designs had a duration of ∼17 min: 1) a behavior interleaved gradients (BIG; Eden et al. [1999] J Magn Reson Imaging 41:13–20) design (repetition time, TR, = 6 s), where stimuli were presented during the SBN‐free periods between clustered volume acquisitions (CVA); 2) a sparse temporal sampling technique (STsamp; e.g., Gaab et al., [2003] Neuroimage 19:1417–1426) acquiring only one set of slices following each of the stimulations with a 16‐s TR and jittered delay times between stimulus offset and image acquisition; and 3) an event‐related design with continuous scanning (ERcont) using the stimulation design of STsamp but with a 2‐s TR. The results demonstrated increased signal within Heschl's gyrus for the STsamp and BIG‐CVA design in comparison to ERcont as well as differences in the overall functional anatomy among the designs. The possibility to obtain a time course of activation as well as the full recovery of the stimulus‐ and SBN‐induced hemodynamic response function signal and lack of signal suppression from SBN during the STsamp design makes this technique a powerful approach for conducting auditory experiments using fMRI. Practical strengths and limitations of the three auditory acquisition paradigms are discussed. Hum Brain Mapp, 2006. © 2006 Wiley‐Liss, Inc.
2006 Wiley-Liss, Inc.
Figures
Figure 1
Experimental stimulation (A). Experimental condition (B). Control condition as well as image acquisition for STsamp. The delay between the end of the auditory stimulation and the beginning of the image acquisition was varied over 8 s. Each ITP corresponds to the volume acquired after the end of auditory stimulation, e.g., ITP0 corresponds to volumes acquired 0 s after the end of the auditory stimulation, and ITP5 corresponds to volumes acquired 5 s after the end of the auditory stimulation.
Figure 2
Experimental designs with timing of auditory stimulation and image acquisition. A: Sparse temporal sampling (STsamp) design. B: Event‐related with continuous scanning design (ERcont). C: Clustered volume acquisition design (BIG‐CVA). Lighter gray blocks reflect auditory/silence stimulation and darker gray (or yellow) blocks image acquisitions. D: ER65: Selecting the (in comparison to STsamp) time corresponding 65 scans (in gray/black‐yellow stripes) out of the ERcont design enables the direct comparison between the two designs and the direct assessment of the influence of SBN on signal intensities.
Figure 3
Imaging results for the three experimental designs and the subset ER65 (P < 0.025, corrected for multiple comparisons, false discovery rate (FDR)). Each row depicts one of the four designs in 3D rendering (left 2 columns) and in axial slices (right 3 columns) for activations in Table I. [Color figure can be viewed in the online issue, which is available at www.interscience.wiley.com.\]
Figure 4
Imaging results (random‐effects analysis) for the direct comparison between STsamp and ER65 (P < 0.05, corrected for multiple comparisons, FDR). [Color figure can be viewed in the online issue, which is available at www.interscience.wiley.com.\]
Figure 5
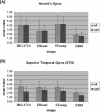
Results for the ROI analysis for the three experimental designs and the subset ER65: (A) Heschl's gyrus (B) superior temporal gyrus.
Figure 6
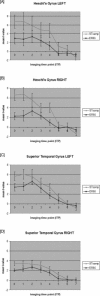
Results for the ROI time point analysis for STsamp and ER65 for (A) left Heschl's gyrus (B) right Heschl's gyrus (C) left superior temporal gyrus (D) right superior temporal gyrus.
Figure 7
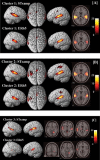
Imaging results for the cluster analysis for STsamp and ER65 (P < 0.05, corrected for multiple comparisons (FWE)) (A) cluster 1 (ITP0‐1), (B) cluster 2 (ITP2‐3), (C) cluster 3 (ITP4‐5). Cluster 4 did not reveal significant voxels for this threshold. 3D‐rendered images (left) and axial slices (right) are selected based on regions activated in experimental designs as shown in Table II. [Color figure can be viewed in the online issue, which is available at www.interscience.wiley.com.\]
Figure 8
Comparison of activation measured in auditory ROIs with CNR calculated for each design, based on response to auditory stimuli normalized to the STsamp design. ER65 shows much lower values than predicted and significantly lower values (see ROI Analysis) than STsamp due to masking and elevated baseline effects.
Similar articles
- Reducing the interval between volume acquisitions improves "sparse" scanning protocols in event-related auditory fMRI.
Liem F, Lutz K, Luechinger R, Jäncke L, Meyer M. Liem F, et al. Brain Topogr. 2012 Apr;25(2):182-93. doi: 10.1007/s10548-011-0206-x. Epub 2011 Oct 21. Brain Topogr. 2012. PMID: 22015572 - Silent and continuous fMRI scanning differentially modulate activation in an auditory language comprehension task.
Schmidt CF, Zaehle T, Meyer M, Geiser E, Boesiger P, Jancke L. Schmidt CF, et al. Hum Brain Mapp. 2008 Jan;29(1):46-56. doi: 10.1002/hbm.20372. Hum Brain Mapp. 2008. PMID: 17318832 Free PMC article. - Study design in fMRI: basic principles.
Amaro E Jr, Barker GJ. Amaro E Jr, et al. Brain Cogn. 2006 Apr;60(3):220-32. doi: 10.1016/j.bandc.2005.11.009. Epub 2006 Jan 19. Brain Cogn. 2006. PMID: 16427175 Review. - Using neuroimaging to understand the cortical mechanisms of auditory selective attention.
Lee AK, Larson E, Maddox RK, Shinn-Cunningham BG. Lee AK, et al. Hear Res. 2014 Jan;307:111-20. doi: 10.1016/j.heares.2013.06.010. Epub 2013 Jul 9. Hear Res. 2014. PMID: 23850664 Free PMC article. Review.
Cited by
- Neural mechanisms underlying the facilitation of naming in aphasia using a semantic task: an fMRI study.
Heath S, McMahon KL, Nickels L, Angwin A, Macdonald AD, van Hees S, Johnson K, McKinnon E, Copland DA. Heath S, et al. BMC Neurosci. 2012 Aug 10;13:98. doi: 10.1186/1471-2202-13-98. BMC Neurosci. 2012. PMID: 22882806 Free PMC article. - Sparse Sampling of Silence Type I Errors With an Emphasis on Primary Auditory Cortex.
Manno FAM, Fernandez-Ruiz J, Manno SHC, Cheng SH, Lau C, Barrios FA. Manno FAM, et al. Front Neurosci. 2019 May 31;13:516. doi: 10.3389/fnins.2019.00516. eCollection 2019. Front Neurosci. 2019. PMID: 31213968 Free PMC article. - Effect of sound intensity on tonotopic fMRI maps in the unanesthetized monkey.
Tanji K, Leopold DA, Ye FQ, Zhu C, Malloy M, Saunders RC, Mishkin M. Tanji K, et al. Neuroimage. 2010 Jan 1;49(1):150-7. doi: 10.1016/j.neuroimage.2009.07.029. Epub 2009 Jul 22. Neuroimage. 2010. PMID: 19631273 Free PMC article. - Investigating the neural correlates of voice versus speech-sound directed information in pre-school children.
Raschle NM, Smith SA, Zuk J, Dauvermann MR, Figuccio MJ, Gaab N. Raschle NM, et al. PLoS One. 2014 Dec 22;9(12):e115549. doi: 10.1371/journal.pone.0115549. eCollection 2014. PLoS One. 2014. PMID: 25532132 Free PMC article. - Self-specific stimuli interact differently than non-self-specific stimuli with eyes-open versus eyes-closed spontaneous activity in auditory cortex.
Qin P, Grimm S, Duncan NW, Holland G, Guo JS, Fan Y, Weigand A, Baudewig J, Bajbouj M, Northoff G. Qin P, et al. Front Hum Neurosci. 2013 Jul 29;7:437. doi: 10.3389/fnhum.2013.00437. eCollection 2013. Front Hum Neurosci. 2013. PMID: 23908625 Free PMC article.
References
- Ackermann H, Mathiak K, Yvry RB ( 2004): Temporal organization of “internal speech” as a basis for cerebellar modulation of cognitive functions. Behav Cog Neurosci Rev 3: 14–22. - PubMed
- Amaro E, Williams SCR, Shergill SS, Fu CHY, MacSweeney M, Picchioni MM, Brammer MJ, McGuire PK ( 2002): Acoustic noise and functional magnetic resonance imaging: current strategies and future prospects. J Magn Reson Imaging 16: 497–510. - PubMed
- Andreasen NC, O'Leary DS, Cizadlo T, Arndt S, Rezai K, Watkins GL, Ponto LL, Hichwa RD ( 1995): II. PET studies of memory: novel versus practiced free recall of word lists. Neuroimage 2: 296–305. - PubMed
- Bandettini PA, Jesmanowicz A, Van Kylen J, Birn RM, Hyde JS ( 1998): Functional MRI of brain activation induced by scanner acoustic noise. Magn Reson Med 39: 410–416. - PubMed
- Baumgart F, Gaschler‐Markefski B, Tempelmann C, Tegeler C, Heinze HJ, Scheich H ( 1996): Masking of acoustic stimuli by the gradient noise alters the fMRI detectable activation in a particular human auditory cortex. MAGMA 4: 185.
Publication types
MeSH terms
LinkOut - more resources
Full Text Sources
Medical


