Increased expression of the immediate-early gene arc/arg3.1 reduces AMPA receptor-mediated synaptic transmission - PubMed (original) (raw)
Comparative Study
Increased expression of the immediate-early gene arc/arg3.1 reduces AMPA receptor-mediated synaptic transmission
Emiliano M Rial Verde et al. Neuron. 2006.
Abstract
Arc/Arg3.1 is an immediate-early gene whose expression levels are increased by strong synaptic activation, including synapse-strengthening activity patterns. Arc/Arg3.1 mRNA is transported to activated dendritic regions, conferring the distribution of Arc/Arg3.1 protein both temporal correlation with the inducing stimulus and spatial specificity. Here, we investigate the effect of increased Arc/Arg3.1 levels on synaptic transmission. Surprisingly, Arc/Arg3.1 reduces the amplitude of synaptic currents mediated by AMPA-type glutamate receptors (AMPARs). This effect is prevented by RNAi knockdown of Arc/Arg3.1, by deleting a region of Arc/Arg3.1 known to interact with endophilin 3 or by blocking clathrin-coated endocytosis of AMPARs. In the hippocampal slice, Arc/Arg3.1 results in removal of AMPARs composed of GluR2 and GluR3 subunits (GluR2/3). Finally, Arc/Arg3.1 expression occludes NMDAR-dependent long-term depression. Our results demonstrate that Arc/Arg3.1 reduces the number of GluR2/3 receptors leading to a decrease in AMPAR-mediated synaptic currents, consistent with a role in the homeostatic regulation of synaptic strength.
Figures
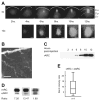
Figure 1. Recombinant Arc/Arg3.1 Expression Levels and Time Course
(A) Epifluorescent images of slices injected in a single site in CA1. Scale bar: 200 μm for both 4× and 10× objectives. The solid white line indicates the edge of the slice. The dashed lines indicate the different layers of the CA1 region: So: stratum oriens, Sp: stratum pyramidale, Sr: stratum radiatum. (B) Two-photon image of dendrites of a pyramidal cell showing the localization of Arc/Arg3.1-GFP in dendritic spines. Scale bar: 10 μm. (C) The time course of recombinant Arc/Arg3.1 (rARC) expression assessed by western blot. Times shown are hours after virus injection. (D) Relative expression levels of recombinant Arc/Arg3.1 and endogenous Arc/Arg3.1 (eARC) in three samples. The ratio for each example is indicated below the blot. (E) Box and whisker graph showing the recombinant to endogenous Arc/Arg3.1 ratios. The bars indicate the range, the box the IQR, and the line the median of the data.
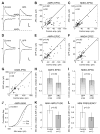
Figure 2. Arc/Arg3.1 Reduces AMPAR-Mediated Current Amplitudes
(A) AMPAR- and NMDAR-mediated EPSCs from a control cell (left) and an neighboring Arc/Arg3.1-expressing cell (right), recorded simultaneously. Dotted lines indicate control cell amplitudes. Scale bar: 10 pA, 10 ms. (B and C) Arc/Arg3.1 depresses evoked AMPAR- but not NMDAR-mediated synaptic responses. Scatter plots of synaptic amplitudes mediated by AMPARs (B) and NMDARs (C) in Arc/Arg3.1-expressing cells (y axis) and neighboring control cells (x axis). In this and all subsequent scatter plots, each dot represents a simultaneous paired recording. Wilcoxon test significance is shown. Star indicates median. Diagonal line indicates unitary slope (y = x). (D) Representative traces of AMPAR- and NMDAR-mediated currents from a control cell (left) and an neighboring GFP-expressing cell (right). Scale bar: 10 pA, 10 ms. (E and F) Viral expression of GFP does not affect AMPAR- or NMDAR-mediated synaptic currents. Scatter plots comparing amplitudes of synaptic AMPAR (E)- and NMDAR (F)-mediated responses in GFP-expressing cells (y axis) and neighboring control cells (x axis). (G) Arc/Arg3.1 expression does not affect GABAR-mediated synaptic transmission. Scatter plot of the amplitude of GABAR-mediated IPSCs in Arc/Arg3.1-expressing cells (y axis) and neighboring control cells (x axis). (H and I) Amplitudes of AMPAR (H)- and NMDAR (I)-mediated currents in infected neurons normalized to neighboring control neurons for GFP- and Arc/Arg3.1-infected slices. Data are expressed as median and IQR. Mann-Whitney test significance is indicated. (J–L) Arc/Arg3.1 decreases AMPAR mini amplitude, but not mini frequency. Cumulative frequency of amplitudes for all AMPAR mEPSC events (J) (Arc/Arg3.1: dashed line, n = 2764; control: solid line, n = 3720). Kolmogorov-Smirnov test significance is indicated. Average mEPSC amplitudes (K) and frequency (L) per cell, expressed as median and IQR. Mann-Whitney test significance is indicated.
Figure 3. The Effect of Arc/Arg3.1 Is Constant Overdevelopment
(A) Western blot showing the increase of endogenous Arc/Arg3.1 (eARC) with time in culture. The same blot reprobed with tubulin antibody was used as a loading control. (B) Simultaneous paired recordings of AMPAR- and NMDAR-mediated currents from a control cell (left) and a neighboring Arc/Arg3.1-expressing cell (right) in a slice after 3 WIC. Scale bar: 10 pA, 10 ms. (C and D) Scatter plots of amplitudes of evoked responses mediated by AMPARs (C) and NMDARs (D) in Arc/Arg3.1-expressing cells (y axis) and neighboring control cells (x axis) recorded in slices after 3 WIC. (E and F) Comparison of the effect of GFP and Arc/Arg3.1 on AMPAR (E)- and NMDAR (F)- mediated currents in slices after 1 or 3 WIC. Responses of infected neurons are normalized to neighboring control neurons. Mann- Whitney significance is indicated.
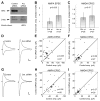
Figure 4. Arc/Arg3.1 siRNA Prevents the Reduction of AMPA EPSCs
(A) Western blot of Cos-1 cells transfected with the Arc/Arg3.1 complete coding sequence and siRNA against Arc/Arg3.1 or control siRNA. The same blot reprobed with β-tubulin antibody was used as a loading control. (B and C) Amplitudes of AMPAR (B)- and NMDAR (C)-mediated currents in transfected neurons normalized to neighboring control neurons for control siRNA and Arc/Arg3.1 siRNA-transfected slices. Data are expressed as median and IQR. Mann-Whitney test significance is indicated. (D) Simultaneous paired recordings of AMPAR- and NMDAR-mediated currents from a control cell (left) and a neighboring Arc/Arg3.1 siRNA-transfected cell (right). Scale bar: 10 pA, 10 ms. (E and F) Scatter plots of amplitudes of evoked responses mediated by AMPARs (E) and NMDARs (F) in Arc/Arg3.1 siRNA-transfected cells (y axis) and neighboring control cells (x axis). (G) Simultaneous paired recordings of AMPAR- and NMDAR-mediated currents from a control cell (left) and a neighboring control siRNA-transfected cell (right). Scale bar: 10 pA, 10 ms. (H and I) Scatter plots of amplitudes of evoked responses mediated by AMPARs (H) and NMDARs (I) in control siRNA-transfected cells (y axis) and neighboring control cells (x axis).
Figure 5. The Effect of Arc/Arg3.1 Is Independent of Neuronal Activity
(A) AMPAR-mediated EPSC amplitudes from GFP-expressing or Arc/Arg3.1-expressing neurons under the conditions stated, expressed as median and IQR. NS: Wilcoxon, p > 0.05; *Wilcoxon, p < 0.05. (B) Two-photon image showing Arc/Arg3.1- GFP localization to dendritic spines in slices exposed to 200 μM DL-APV, a treatment that prevents endogenous Arc/Arg3.1 mRNA induction and localization. Scale bar: 10 μm. (C) AMPAR response amplitudes from GFP and Arc/Arg3.1-expressing neurons normalized to neighboring control neurons. Arc/Arg3.1 depresses AMPAR-mediated responses even in the presence of drugs that reduce activity levels. *p < 0.05 in Mann- Whitney test and in Kruskal-Wallis with Dunnett’s posthoc test.
Figure 6. Arc/Arg3.1 Induces AMPAR Endocytosis
(A) Simultaneous paired recordings from control cells (left) and neighboring cells expressing GFP + pep-AP2 (right top) and Arc/Arg3.1 + pep- AP2 (right bottom). Scale bar: 10 pA, 10 ms. (B and C) Scatter plots of AMPAR response amplitudes in cells coexpressing GFP (B) or Arc/Arg3.1 (C) with pep-AP2 (y axis) and neighboring control cells (x axis). (D) AMPAR response amplitudes in GFP, GFP + pep-AP2, and Arc/Arg3.1 + pep-AP2 neurons normalized to responses in neighboring control neurons. Kruskal-Wallis test significance is indicated. (E) Simultaneous paired recordings from a control cell (left) and neighboring cell expressing Arc/Arg3.1(Δ91–100). (F) Scatter plot of AMPAR response amplitudes for cells expressing Arc/Arg3.1(Δ91–100) (y axis) compared to neighboring control cells (x axis). (G) Normalized AMPAR response amplitudes in cells expressing GFP alone or Arc/Arg3.1(Δ91–100). Mann-Whitney test significance is indicated. (H) Image showing the localization of Arc/Arg3.1(Δ91–100) to dendritic spines.
Figure 7. Arc/Arg3.1 Decreases Surface GluR2/3 AMPARs
(A) Simultaneous paired recordings from control cells (left) and neighboring cells coexpressing the GluR2 c-tail (GluR2 ct.) with either GFP (right top) or Arc/Arg3.1 (right bottom). Scale bar: 10 pA, 10 ms. (B and C) Scatter plots of AMPAR response amplitudes for cells coexpressing GFP (B) or Arc/Arg3.1 (C) with GluR2 c-tail (y axis) compared to neighboring control cells (x axis). (D) Normalized AMPAR response amplitudes in cells expressing Arc/Arg3.1, GFP + GluR2 c-tail, and Arc/Arg3.1 + GluR2 c-tail. Kruskal-Wallis test significance is indicated. (E) Examples of western blots showing the total protein lane (20% of the homogenate) and the adjacent biotinylated protein lane (precipitated from the remaining 80% of the same homogenate). Examples of GluR2 and GluR1 western blots from slices expressing GFP or Arc/Arg3.1. Control experiments of the binding to the streptavidin beads in the absence of biotinylation reagent (GFP NO BIOT.), and of intracellular protein biotinylation (PICK1 and β-tubulin). (F) Median and IQR of surface to total protein ratio for GluR2, normalized to the median ratio for GFP-expressing slices. Mann-Whitney significance is indicated. (G) Same as (F) for GluR1.
Figure 8. Arc/Arg3.1 Expression Shares Properties with LTD
(A) LTD recordings in cells with increased levels of recombinant Arc/Arg3.1 (gray squares) and control cells (black circles). Average EPSC amplitude normalized to the mean baseline amplitude. Mann-Whitney significance, comparing Arc/Arg3.1 and control cells, over the last 5 min is indicated. (B) Simultaneous paired LTD recordings from neurons expressing recombinant Arc/Arg3.1 and uninfected neighboring cells. Average absolute amplitudes are shown. Mann-Whitney significance, comparing Arc/Arg3.1 and adjacent control cells, is indicated for the baseline and last 5 min. (C and G) Simultaneous paired recordings of AMPAR-mediated currents from a control cell (left) and a neighboring Arc/Arg3.1-infected cell (right), in slices treated with 1 μM okadaic acid (C) or 50 μM FK506 (G). Scale bar: 10 pA, 10 ms. (D and H) Scatter plots of amplitudes of evoked responses mediated by AMPARs in Arc/Arg3.1-infected cells (y axis) and neighboring control cells (x axis), in slices treated with okadaic acid (D) or FK506 (H). (E and I) Amplitudes of AMPAR-mediated currents in infected neurons normalized to neighboring control neurons for GFP-infected slices and Arc/Arg3.1-infected slices treated with okadaic acid (E) or FK506 (I). Data are expressed as median and IQR. Mann-Whitney test significance is indicated. (F and J) Images showing the localization of recombinant Arc/Arg3.1 to dendritic spines in slices treated with okadaic acid (F) or FK506 (J).
Figure 9. Model for Arc/Arg3.1 Action
The schematic illustrates the scenario in which a region of the dendrite receives a synapse-strengthening stimulus that causes different amounts of potentiation in three neighboring synapses and induces Arc/Arg3.1 mRNA expression and localization to that region. Synapse 1 is 100% potentiated, synapse 2 is not potentiated, and synapse 3 is 50% potentiated. Arc/Arg3.1 preferentially affects synapses with relatively more GluR2/3 content. Consequently, the potentiated-to-nonpotentiated synaptic-strength ratio is increased by Arc/Arg3.1-induced GluR2/3 removal, e.g., synapse 1-to-synapse 2 ratio: initially 1, becomes 2 after LTP and increases to 3 after Arc/Arg3.1 has acted. In addition, total synaptic strength for that dendritic region is homeostatically regulated (initially 6, becomes 9 after LTP, returning to 6 after Arc/Arg3.1’s action).
Similar articles
- Arc/Arg3.1 mediates homeostatic synaptic scaling of AMPA receptors.
Shepherd JD, Rumbaugh G, Wu J, Chowdhury S, Plath N, Kuhl D, Huganir RL, Worley PF. Shepherd JD, et al. Neuron. 2006 Nov 9;52(3):475-84. doi: 10.1016/j.neuron.2006.08.034. Neuron. 2006. PMID: 17088213 Free PMC article. - Rap2-JNK removes synaptic AMPA receptors during depotentiation.
Zhu Y, Pak D, Qin Y, McCormack SG, Kim MJ, Baumgart JP, Velamoor V, Auberson YP, Osten P, van Aelst L, Sheng M, Zhu JJ. Zhu Y, et al. Neuron. 2005 Jun 16;46(6):905-16. doi: 10.1016/j.neuron.2005.04.037. Neuron. 2005. PMID: 15953419 - A specific requirement of Arc/Arg3.1 for visual experience-induced homeostatic synaptic plasticity in mouse primary visual cortex.
Gao M, Sossa K, Song L, Errington L, Cummings L, Hwang H, Kuhl D, Worley P, Lee HK. Gao M, et al. J Neurosci. 2010 May 26;30(21):7168-78. doi: 10.1523/JNEUROSCI.1067-10.2010. J Neurosci. 2010. PMID: 20505084 Free PMC article. - Arc/Arg3.1: linking gene expression to synaptic plasticity and memory.
Tzingounis AV, Nicoll RA. Tzingounis AV, et al. Neuron. 2006 Nov 9;52(3):403-7. doi: 10.1016/j.neuron.2006.10.016. Neuron. 2006. PMID: 17088207 Review. - The immediate early gene arc/arg3.1: regulation, mechanisms, and function.
Bramham CR, Worley PF, Moore MJ, Guzowski JF. Bramham CR, et al. J Neurosci. 2008 Nov 12;28(46):11760-7. doi: 10.1523/JNEUROSCI.3864-08.2008. J Neurosci. 2008. PMID: 19005037 Free PMC article. Review.
Cited by
- Secreted Amyloid Precursor Protein-Alpha Enhances LTP Through the Synthesis and Trafficking of Ca2+-Permeable AMPA Receptors.
Livingstone RW, Elder MK, Singh A, Westlake CM, Tate WP, Abraham WC, Williams JM. Livingstone RW, et al. Front Mol Neurosci. 2021 Apr 1;14:660208. doi: 10.3389/fnmol.2021.660208. eCollection 2021. Front Mol Neurosci. 2021. PMID: 33867938 Free PMC article. - Amyloid-β effects on synapses and memory require AMPA receptor subunit GluA3.
Reinders NR, Pao Y, Renner MC, da Silva-Matos CM, Lodder TR, Malinow R, Kessels HW. Reinders NR, et al. Proc Natl Acad Sci U S A. 2016 Oct 18;113(42):E6526-E6534. doi: 10.1073/pnas.1614249113. Epub 2016 Oct 5. Proc Natl Acad Sci U S A. 2016. PMID: 27708157 Free PMC article. - Arc/Arg3.1 mRNA global expression patterns elicited by memory recall in cerebral cortex differ for remote versus recent spatial memories.
Gusev PA, Gubin AN. Gusev PA, et al. Front Integr Neurosci. 2010 May 21;4:15. doi: 10.3389/fnint.2010.00015. eCollection 2010. Front Integr Neurosci. 2010. PMID: 20577636 Free PMC article. - An in vitro model of neuronal ensembles.
Rabadan MA, De La Cruz ED, Rao SB, Chen Y, Gong C, Crabtree G, Xu B, Markx S, Gogos JA, Yuste R, Tomer R. Rabadan MA, et al. Nat Commun. 2022 Jun 9;13(1):3340. doi: 10.1038/s41467-022-31073-1. Nat Commun. 2022. PMID: 35680927 Free PMC article. - Contribution of Egr1/zif268 to Activity-Dependent Arc/Arg3.1 Transcription in the Dentate Gyrus and Area CA1 of the Hippocampus.
Penke Z, Chagneau C, Laroche S. Penke Z, et al. Front Behav Neurosci. 2011 Aug 17;5:48. doi: 10.3389/fnbeh.2011.00048. eCollection 2011. Front Behav Neurosci. 2011. PMID: 21887136 Free PMC article.
References
- Berger UV, Lu XCM, Liu WL, Tang ZC, Slusher BS, Hediger MA. Effect of middle cerebral artery occlusion on mRNA expression for the sodium-coupled vitamin C transporter SVCT2 in rat brain. J Neurochem. 2003;86:896–906. - PubMed
- Bredt DS, Nicoll RA. AMPA receptor trafficking at excitatory synapses. Neuron. 2003;40:361–379. - PubMed
- Buchs PA, Stoppini L, Muller D. Structural modifications associated with synaptic development in area CA1 of rat hippocampal organotypic cultures. Brain Res Dev Brain Res. 1993;71:81–91. - PubMed
- Burrone J, O’Byrne M, Murthy VN. Multiple forms of synaptic plasticity triggered by selective suppression of activity in individual neurons. Nature. 2002;420:414–418. - PubMed
- Carroll RC, Beattie EC, von Zastrow M, Malenka RC. Role of AMPA receptor endocytosis in synaptic plasticity. Nat Rev Neurosci. 2001;2:315–324. - PubMed
Publication types
MeSH terms
Substances
LinkOut - more resources
Full Text Sources
Other Literature Sources
Molecular Biology Databases


