A comparative analysis of genome-wide chromatin immunoprecipitation data for mammalian transcription factors - PubMed (original) (raw)
Comparative Study
A comparative analysis of genome-wide chromatin immunoprecipitation data for mammalian transcription factors
Hongkai Ji et al. Nucleic Acids Res. 2006.
Abstract
Genome-wide location analysis (ChIP-chip, ChIP-PET) is a powerful technique to study mammalian transcriptional regulation. In order to obtain a basic understanding of the location data generated for mammalian transcription factors and potential issues in their analysis, we conducted a comparative study of eight independent ChIP experiments involving six different transcription factors in human and mouse. Our cross-study comparisons, to the best of our knowledge the first to analyze multiple datasets, revealed the importance of carefully chosen genomic controls in the de novo identification of key transcription factor binding motifs, raised issues about the interpretation of ubiquitously occurring sequence motifs, and demonstrated the clustering tendency of protein-binding regions for certain transcription factors.
Figures
Figure 1
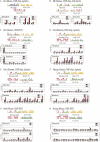
Comparisons of de novo motif discovery from multiple ChIP studies. Eight experiments were examined here, including (A) Gli-chip, (B) ER-chip, (C) p53-PET, (D) Oct4-chip, (E) Sox2-chip, (F) Nanog-chip, (G) Oct4-PET and (H) Nanog-PET. For each factor, representative motifs recovered by de novo discovery are shown. The motif score reported by Gibbs motif sampler for each motif is shown in parantheses. The complete lists of motifs reported by Gibbs motif sampler are present in Supplementary Figures S1–S8. For each reported motif, the relative enrichment level _r_1, _r_2 and _r_3 were computed by comparing TFBS occurrence rates in ChIP regions to their counterparts in matched genomic controls (labeled by ‘Matched’) or random genomic controls (labeled by ‘Random’). The enrichment levels of all discovered motifs are compared here, and the data used to generate the figures are listed in Supplementary Tables S1–S8. The motifs responsible for the sequence-specific protein binding are underlined or indicated by arrows. For Nanog-chip and Nanog-PET, the motif responsible for the binding was unknown. In these two cases, Oct-Sox composite motif was highlighted, and the relative enrichment levels of the previously proposed Nanog motif (4) (labeled by ‘Nanog’) are also shown. For Gli-chip, ER-chip, Oct4-chip, Sox2-chip and Nanog-chip, enrichment levels in relative to design-based controls were also computed and are shown in Supplementary Figure S9.
Figure 2
Motifs that contain one or more CCCAG components. CCCAG components are highlighted by dashed rectangles. Arrows indicate possible repetitive or palindrome structures. Motifs are indexed by the experiment from which they were recovered (e.g. p53_M8 means that the motif was recovered from p53 data and was the eighth strongest one in that experiment in terms of motif score).
Figure 3
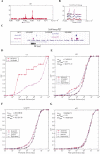
GC-content and cross-species conservation of ChIP-binding regions. (A) GC-content of ChIP-binding regions. Blue bar, genome-wide GC-content; cyan bar, GC-content for ChIP-binding regions; yellow bar, GC-content for genomic regions surveyed by the ChIP experiments; red bar, GC-content for matched genomic controls. The error bar shows three times standard error for the GC-content estimate. For p53-PET, Oct4-PET and Nanog-PET, the regions surveyed by the ChIP experiments are the whole genome; for ER-chip, they are human chr21 and chr22; for Oct4-chip, Sox2-chip and Nanog-chip, they are promoter regions that span from −8 to +2 kb of TSS; for Gli-chip, they are regions tiled in the custom array. Matched genomic controls used here are the same control regions used for relative enrichment computation. Detailed base occurrence frequencies for A, C, G and T are listed in Supplementary Table S9. (B and C) Cumulative probability function of conservation scores for ChIP regions and genomes. Conservation scores are defined for each base pair and were linearly scaled to interval [0, 255]. A large score corresponds to a more conserved status. Human Genome, genome-wide conservation for human; Human Promoter, conservation for human promoter regions spanning from −8 to +2 kb of TSS; Human chr21 and 22, conservation for human chr21 and chr22; and 22, conservation for human chr21 and chr22; Mouse Genome, genome-wide conservation for mouse; Mouse tiled in Gli, conservation for regions surveyed in the Gli study, i.e. regions tiled in the custom array.
Figure 4
Clustering tendency of binding regions. (A–C) Three examples of binding region clusters. The transcription factor that binds to DNA is shown on the top of each figure. The gene that is bound by the transcription factor is shown on the bottom of the figure. For the two ChIP-chip examples (A and B), binding regions are indicated by high fold enrichment of IP samples versus control samples (i.e. peaks in the figure). For the ChIP-PET example (C), binding regions are indicated by the blocks in the ‘Oct4-PET’ and ‘Nanog-PET’ track in the UCSC genome browser. (D–G) Cumulative probability functions (CDF) of the observed and simulated peak-to-peak distance. The simulated distance was considered to be the random distribution. Observed and simulated distributions were fitted by Gamma and Exponential density respectively, the fitted CDF are also shown.
Similar articles
- De novo prediction of cis-regulatory elements and modules through integrative analysis of a large number of ChIP datasets.
Niu M, Tabari ES, Su Z. Niu M, et al. BMC Genomics. 2014 Dec 2;15:1047. doi: 10.1186/1471-2164-15-1047. BMC Genomics. 2014. PMID: 25442502 Free PMC article. - Ab initio identification of putative human transcription factor binding sites by comparative genomics.
Corà D, Herrmann C, Dieterich C, Di Cunto F, Provero P, Caselle M. Corà D, et al. BMC Bioinformatics. 2005 May 2;6:110. doi: 10.1186/1471-2105-6-110. BMC Bioinformatics. 2005. PMID: 15865625 Free PMC article. - Integrative analysis of ChIP-chip and ChIP-seq dataset.
Zhu LJ. Zhu LJ. Methods Mol Biol. 2013;1067:105-24. doi: 10.1007/978-1-62703-607-8_8. Methods Mol Biol. 2013. PMID: 23975789 - Genomic studies of transcription factor-DNA interactions.
Sikder D, Kodadek T. Sikder D, et al. Curr Opin Chem Biol. 2005 Feb;9(1):38-45. doi: 10.1016/j.cbpa.2004.12.008. Curr Opin Chem Biol. 2005. PMID: 15701451 Review. - Serial analysis of binding elements for transcription factors.
Chen J. Chen J. Methods Mol Biol. 2009;567:113-32. doi: 10.1007/978-1-60327-414-2_8. Methods Mol Biol. 2009. PMID: 19588089 Review.
Cited by
- Integrative analysis of the zinc finger transcription factor Lame duck in the Drosophila myogenic gene regulatory network.
Busser BW, Huang D, Rogacki KR, Lane EA, Shokri L, Ni T, Gamble CE, Gisselbrecht SS, Zhu J, Bulyk ML, Ovcharenko I, Michelson AM. Busser BW, et al. Proc Natl Acad Sci U S A. 2012 Dec 11;109(50):20768-73. doi: 10.1073/pnas.1210415109. Epub 2012 Nov 26. Proc Natl Acad Sci U S A. 2012. PMID: 23184988 Free PMC article. - Active N6-Methyladenine Demethylation by DMAD Regulates Gene Expression by Coordinating with Polycomb Protein in Neurons.
Yao B, Li Y, Wang Z, Chen L, Poidevin M, Zhang C, Lin L, Wang F, Bao H, Jiao B, Lim J, Cheng Y, Huang L, Phillips BL, Xu T, Duan R, Moberg KH, Wu H, Jin P. Yao B, et al. Mol Cell. 2018 Sep 6;71(5):848-857.e6. doi: 10.1016/j.molcel.2018.07.005. Epub 2018 Aug 2. Mol Cell. 2018. PMID: 30078725 Free PMC article. - Searching ChIP-seq genomic islands for combinatorial regulatory codes in mouse embryonic stem cells.
Chen G, Zhou Q. Chen G, et al. BMC Genomics. 2011 Oct 20;12:515. doi: 10.1186/1471-2164-12-515. BMC Genomics. 2011. PMID: 22011333 Free PMC article. - Identification of a binding motif specific to HNF4 by comparative analysis of multiple nuclear receptors.
Fang B, Mane-Padros D, Bolotin E, Jiang T, Sladek FM. Fang B, et al. Nucleic Acids Res. 2012 Jul;40(12):5343-56. doi: 10.1093/nar/gks190. Epub 2012 Mar 1. Nucleic Acids Res. 2012. PMID: 22383578 Free PMC article. - High-throughput chromatin information enables accurate tissue-specific prediction of transcription factor binding sites.
Whitington T, Perkins AC, Bailey TL. Whitington T, et al. Nucleic Acids Res. 2009 Jan;37(1):14-25. doi: 10.1093/nar/gkn866. Epub 2008 Nov 6. Nucleic Acids Res. 2009. PMID: 18988630 Free PMC article.
References
- Carroll J.S., Liu X.S., Brodsky A.S., Li W., Meyer C.A., Szary A.J., Eeckhoute J., Shao W., Hestermann E.V., Geistlinger T.R., et al. Chromosome-wide mapping of estrogen receptor binding reveals long-range regulation requiring the forkhead protein FoxA1. Cell. 2005;122:33–43. - PubMed
- Wei C.L., Wu Q., Vega V.B., Chiu K.P., Ng P., Zhang T., Shahab A., Yong H.C., Fu Y., Weng Z., et al. A global map of p53 transcription-factor binding sites in the human genome. Cell. 2006;124:207–219. - PubMed
- Loh Y.H., Wu Q., Chew J.L., Vega V.B., Zhang W., Chen X., Bourque G., George J., Leong B., Liu J., et al. The Oct4 and Nanog transcription network regulates pluripotency in mouse embryonic stem cells. Nature Genet. 2006;38:431–440. - PubMed
- Liu X.S., Brutlag D.L., Liu J.S. An algorithm for finding protein-DNA binding sites with applications to chromatin-immunoprecipitation microarray experiments. Nat. Biotechnol. 2002;20:835–839. - PubMed


