A large-scale full-length cDNA analysis to explore the budding yeast transcriptome - PubMed (original) (raw)
A large-scale full-length cDNA analysis to explore the budding yeast transcriptome
Fumihito Miura et al. Proc Natl Acad Sci U S A. 2006.
Abstract
We performed a large-scale cDNA analysis to explore the transcriptome of the budding yeast Saccharomyces cerevisiae. We sequenced two cDNA libraries, one from the cells exponentially growing in a minimal medium and the other from meiotic cells. Both libraries were generated by using a vector-capping method that allows the accurate mapping of transcription start sites (TSSs). Consequently, we identified 11,575 TSSs associated with 3,638 annotated genomic features, including 3,599 ORFs, to suggest that most yeast genes have two or more TSSs. In addition, we identified 45 previously undescribed introns, including those affecting current ORF annotations and those spliced alternatively. Furthermore, the analysis revealed 667 transcription units in the intergenic regions and transcripts derived from antisense strands of 367 known features. We also found that 348 ORFs carry TSSs in their 3'-halves to generate sense transcripts starting from inside the ORFs. These results indicate that the budding yeast transcriptome is considerably more complex than previously thought, and it shares many recently revealed characteristics with the transcriptomes of mammals and other higher eukaryotes. Thus, the genome-wide active transcription that generates novel classes of transcripts appears to be an intrinsic feature of the eukaryotic cells. The budding yeast will serve as a versatile model for the studies on these aspects of transcriptome, and the full-length cDNA clones can function as an invaluable resource in such studies.
Conflict of interest statement
The authors declare no conflict of interest.
Figures
Fig. 1.
Data of the large-scale cDNA analysis. (A) A screenshot of the UT Genome Browser depicting a region including SDT1, COG1, and EDC1 (coordinate 78,801–80,800 of chromosome 7). Each bar in the GCAP track indicates the 5′-single-pass sequence of each cDNA clone, whose ID is shown at the left side of the bar. Blue and orange indicate Watson and Crick strands, respectively. The sharp (#) at the end of line indicates that the clone is a full-length one with a G-cap-derived nucleotide addition. This screen shows four and one full-length clones for SDT1 and COG1, respectively. In addition, it displays five, one, and one full-length clones for antisense transcripts of COG1, a transcript starting within the COG1 ORF, and a transcription unit lying between COG1 and EDC1 (TU #257 in Table 8), respectively. (B) Breakdown of the cDNA data. Starting from 51,026 clones, 13,159 TSSs were identified (see text for detail).
Fig. 2.
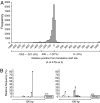
Transcription start sites. (A) Distribution of TSSs around the presumptive initiation codon. (B) Two typical patterns of TSS distribution.
Fig. 3.
Alternative splicing events. The bold line with squares with ORF/gene names shown at the top of each image indicates the genome map, and the arrows shown below the map indicate the transcripts. (A) YNL194C and YNL195C share the same promoter to generate three mRNAs (Left), including a potential bicistronic one detected as a ≈2,000-nt band in Northern blot analysis of SK1 cells (Right). IVT, in vitro transcription. (B) YMR148W has two distinct promoters, and YMR147W may be an upstream exon of YMR148W used in the transcript starting from the distal promoter. (C) A case of transcription-induced chimera between NCE101 and YJL206C.
Fig. 4.
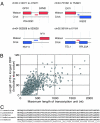
Transcription units in intergenic regions. (A) Examples of isolated transcription unit. Boxes and arrows indicate annotated ORFs and transcripts, respectively. Red and blue indicate features on Watson and Crick strands, respectively. (B) The longest ORF size was plotted against the size of each transcription unit. (C) Conservation of the ORF encoded by the transcription unit no. 633. Identical (∗), conservative (:), and semiconservative (.) residues are indicated.
Fig. 5.
Antisense transcription. (A) A screenshot of the UT Genome Browser depicting GAL1-GAL10 locus. Two cDNA clones (blue lines) were isolated for the antisense transcript of GAL10, which had been hit by a SAGE tag (17). Note that GAL10 also has an internally primed sense transcript (orange lines), which was also detected by the tiling array study (segment ID 1028; ref. 19). (B) The expression of GAL10 is suppressed or induced in the presence of dextrose (Dex) or galactose (Gal), respectively. Coinduction of the sense and antisense transcripts was observed upon addition of Gal.
Similar articles
- Genome-wide profiling of untranslated regions by paired-end ditag sequencing reveals unexpected transcriptome complexity in yeast.
Kang YN, Lai DP, Ooi HS, Shen TT, Kou Y, Tian J, Czajkowsky DM, Shao Z, Zhao X. Kang YN, et al. Mol Genet Genomics. 2015 Feb;290(1):217-24. doi: 10.1007/s00438-014-0913-6. Epub 2014 Sep 12. Mol Genet Genomics. 2015. PMID: 25213602 - Transcript Profiling Analysis Through Paired-End Ditag (PET) Approach Coupled with Deep Sequencing Reveals Transcriptome Complexity in Yeast.
Kang Y, Ooi HS, Zhao X. Kang Y, et al. Methods Mol Biol. 2019;2049:105-112. doi: 10.1007/978-1-4939-9736-7_6. Methods Mol Biol. 2019. PMID: 31602607 - Genome-wide identification of transcriptional start sites in the haloarchaeon Haloferax volcanii based on differential RNA-Seq (dRNA-Seq).
Babski J, Haas KA, Näther-Schindler D, Pfeiffer F, Förstner KU, Hammelmann M, Hilker R, Becker A, Sharma CM, Marchfelder A, Soppa J. Babski J, et al. BMC Genomics. 2016 Aug 12;17(1):629. doi: 10.1186/s12864-016-2920-y. BMC Genomics. 2016. PMID: 27519343 Free PMC article. - Unexpected complexity of the budding yeast transcriptome.
Ito T, Miura F, Onda M. Ito T, et al. IUBMB Life. 2008 Dec;60(12):775-81. doi: 10.1002/iub.121. IUBMB Life. 2008. PMID: 18649367 Review. - Transcriptome analyses of human genes and applications for proteome analyses.
Suzuki Y, Sugano S. Suzuki Y, et al. Curr Protein Pept Sci. 2006 Apr;7(2):147-63. doi: 10.2174/138920306776359795. Curr Protein Pept Sci. 2006. PMID: 16611140 Review.
Cited by
- Control of relative timing and stoichiometry by a master regulator.
Goldschmidt Y, Yurkovsky E, Reif A, Rosner R, Akiva A, Nachman I. Goldschmidt Y, et al. PLoS One. 2015 May 22;10(5):e0127339. doi: 10.1371/journal.pone.0127339. eCollection 2015. PLoS One. 2015. PMID: 26000862 Free PMC article. - Alternative transcription start site selection leads to large differences in translation activity in yeast.
Rojas-Duran MF, Gilbert WV. Rojas-Duran MF, et al. RNA. 2012 Dec;18(12):2299-305. doi: 10.1261/rna.035865.112. Epub 2012 Oct 25. RNA. 2012. PMID: 23105001 Free PMC article. - Roles for transcript leaders in translation and mRNA decay revealed by transcript leader sequencing.
Arribere JA, Gilbert WV. Arribere JA, et al. Genome Res. 2013 Jun;23(6):977-87. doi: 10.1101/gr.150342.112. Epub 2013 Apr 11. Genome Res. 2013. PMID: 23580730 Free PMC article. - Population genomics of intron splicing in 38 Saccharomyces cerevisiae genome sequences.
Skelly DA, Ronald J, Connelly CF, Akey JM. Skelly DA, et al. Genome Biol Evol. 2009 Nov 17;1:466-78. doi: 10.1093/gbe/evp046. Genome Biol Evol. 2009. PMID: 20333215 Free PMC article. - Transcriptome visualization and data availability at the Saccharomyces Genome Database.
Ng PC, Wong ED, MacPherson KA, Aleksander S, Argasinska J, Dunn B, Nash RS, Skrzypek MS, Gondwe F, Jha S, Karra K, Weng S, Miyasato S, Simison M, Engel SR, Cherry JM. Ng PC, et al. Nucleic Acids Res. 2020 Jan 8;48(D1):D743-D748. doi: 10.1093/nar/gkz892. Nucleic Acids Res. 2020. PMID: 31612944 Free PMC article.
References
- Dolinski C, Botstein D. Genome Res. 2005;15:1611–1619. - PubMed
- Giaever G, Chu AM, Ni L, Connelly C, Riles L, Veronneau S, Dow S, Lucau-Danila A, Anderson K, Andre B, et al. Nature. 2002;418:387–391. - PubMed
- Tong AH, Lesage G, Bader GD, Ding H, Xu H, Xin X, Young J, Berriz GF, Brost RL, Chang M, et al. Science. 2004;303:808–813. - PubMed
- Hughes TR, Marton MJ, Jones AR, Roberts CJ, Stoughton R, Armour CD, Bennett HA, Coffey E, Dai H, He YD, et al. Cell. 2000;102:109–126. - PubMed
- Lee TI, Rinaldi NJ, Robert F, Odom DT, Bar-Joseph Z, Gerber GK, Hannett NM, Harbison CT, Thompson CM, Simon I, et al. Science. 2002;298:799–804. - PubMed
Publication types
MeSH terms
Substances
LinkOut - more resources
Full Text Sources
Other Literature Sources
Molecular Biology Databases


