3D complex: a structural classification of protein complexes - PubMed (original) (raw)
3D complex: a structural classification of protein complexes
Emmanuel D Levy et al. PLoS Comput Biol. 2006.
Abstract
Most of the proteins in a cell assemble into complexes to carry out their function. It is therefore crucial to understand the physicochemical properties as well as the evolution of interactions between proteins. The Protein Data Bank represents an important source of information for such studies, because more than half of the structures are homo- or heteromeric protein complexes. Here we propose the first hierarchical classification of whole protein complexes of known 3-D structure, based on representing their fundamental structural features as a graph. This classification provides the first overview of all the complexes in the Protein Data Bank and allows nonredundant sets to be derived at different levels of detail. This reveals that between one-half and two-thirds of known structures are multimeric, depending on the level of redundancy accepted. We also analyse the structures in terms of the topological arrangement of their subunits and find that they form a small number of arrangements compared with all theoretically possible ones. This is because most complexes contain four subunits or less, and the large majority are homomeric. In addition, there is a strong tendency for symmetry in complexes, even for heteromeric complexes. Finally, through comparison of Biological Units in the Protein Data Bank with the Protein Quaternary Structure database, we identified many possible errors in quaternary structure assignments. Our classification, available as a database and Web server at http://www.3Dcomplex.org, will be a starting point for future work aimed at understanding the structure and evolution of protein complexes.
Conflict of interest statement
Competing interests. The authors have declared that no competing interests exist.
Figures
Figure 1. A Hierarchy of Protein Complexes of Known Three-Dimensional Structure
The hierarchy has 12 levels, namely, from top to bottom: QS topology, QS family, QS, QS20, QS30…QS100. At the top of the hierarchy, there are 192 QS topologies. One particular QS topology (orange circle) with four subunits is expanded below. It comprises 161 QS families in total, of which two are detailed: the E. coli lyase and the H. sapiens hemoglobin γ4. All complexes in the E. coli lyase QS family are encoded by a single gene and therefore correspond to a single QS. However, the hemoglobin QS Family contains two QSs: one with a single gene, the hemoglobin γ4, and one with two genes, the hemoglobin α2β2 from H. sapiens. The last level in the hierarchy indicates the number of structures found in the complete set (PDB). There are 30 redundant complexes corresponding to the lyase QS, four corresponding to the hemoglobin γ4 QS, and 80 to the hemoglobin α2β2 QS. We also see that there are 9,978 monomers, 6,803 dimers, 814 triangular trimers, etc. Note that there are intermediate levels using sequence identity thresholds (fourth to twelfth level) between the QS level and the complete set, which are not shown in detail here.
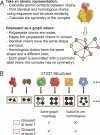
Figure 2. Representing Protein Complexes as Graphs
(A) Each protein complex is transformed into a graph where nodes represent polypeptide chains and edges represent biological interfaces between the chains. (B) All complexes are compared with each other using a customized graph-matching procedure. Complexes with the same graph topology are grouped to form the top level of the hierarchy, as shown by the green boxes. If, in addition, the subunit structures are related by their SCOP domain architectures, they are grouped at the second level, shown by the red boxes. Structures were rendered with VMD [51].
Figure 3. Examples of Quaternary Structure Topologies
(A) All QSTs for complexes with up to nine subunits are shown, accounting for more than 96% of the nonredundant set of QSs and more than 98% of all complexes in PDB. Topologies compatible with a symmetrical complex are annotated with an s, and topologies where all subunits have the same number of interfaces (edges) are annotated by a star (*). (B) Examples of large complexes that are the single representatives of their respective topologies (QSTs). PDB codes are given. 1pf9, E. coli GroEL-GroES-ADP; 1eaf, synthetic construct, pyruvate dehydrogenase; 1shs, Methanococcus jannaschii small heat shock protein; 1b5s, Bacillus stearothermophilus dihydrolipoyl transacetylase; 1j2q, Archaeoglobus fulgidus 20S protesome alpha ring. It is interesting to note that the graph layouts resemble the spatial arrangements of the subunits. (C) Likely errors in the PDB Biological Units: QSTs of homomers with different numbers of contacts amongst the subunits. The number of erroneous QSs in each topology is provided above each graph.
Figure 4. Distribution of Protein Complex Size in the Hierarchy
Histogram of the number of subunits per protein complex. Smaller complexes are more abundant than larger complexes, and complexes with even numbers of subunits tend to be more abundant than complexes with odd numbers of subunits, at both levels of the hierarchy.
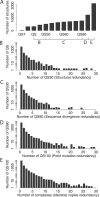
Figure 5. Redundancy in the Protein Data Bank at Several Levels of Sequence Similarity
(A) The number of structures at each level of the 3D Complex database, from 192 QSTs to the total number of structures in the PDB (21,037). The tick marks on the line below the graph indicate the consecutive pairs of levels that are plotted in (B–E). (B) Number of QS30 per QS. Note that QS Families are almost identical to QSs. The first bar in the histogram shows that about 2,500 QS correspond to one QS30; the second bar represents 250 QS that correspond to two QS30. (C) Number of QS90 per QS30. (D) Number of QS100 per QS90. (E) Number of complexes in the complete set per QS100. All distributions display scale-free behaviour, in the sense that a large proportion of groups are identical at any two consecutive levels, whereas a small number are very redundant. Adding symmetry information does not change this trend, as shown in Table 1.
Figure 6. Cyclic and Dihedral Symmetries
(C2) Cyclic symmetry: two subunits are related by a single 2-fold axis, shown by a dashed line. An ellipse at the end of the symmetry axis marks a 2-fold axis. Nearly all homodimers have C2 symmetry. C2 symmetry is termed “2” in the crystallographic Hermann-Mauguin nomenclature, shown in red beneath C2. (C4) Cyclic symmetry: four subunits are related by one 4-fold axis. A square at the end of the symmetry axis marks a 4-fold axis. (D2) Dihedral symmetry: four subunits are related by three 2-fold axes. D2 symmetry can be constructed from two C2 dimers. Note the difference between the D2 and C4 symmetries: two symmetry types that both have four subunits. (D4) Dihedral symmetry: eight subunits are related to each other by one 4-fold axis and two 2-fold axes. Note that D4 symmetry can be constructed by stacking two C4 tetramers as shown, or four C2 dimers (not shown).
Figure 7. The Size of Homomeric Complexes in the Protein Data Bank and in SwissProt
The histogram shows the relative abundances of monomers and homo-oligomers of different sizes in the PDB and in SwissProt. Two PDB sets are shown: the complete set and the nonredundant set of QSs. Three SwissProt sets are shown: the complete SwissProt and the Human and E. coli subsets. The trend in all the sets is similar and highlights the importance of the mechanism of self-assembly, which is linked to many functional possibilities discussed in the text. The oligomeric state of proteins in SwissProt was extracted from the subunit annotation field, and annotations inferred by similarity were not considered.
Similar articles
- Protein complexes: structure prediction challenges for the 21st century.
Aloy P, Pichaud M, Russell RB. Aloy P, et al. Curr Opin Struct Biol. 2005 Feb;15(1):15-22. doi: 10.1016/j.sbi.2005.01.012. Curr Opin Struct Biol. 2005. PMID: 15718128 Review. - PIBASE: a comprehensive database of structurally defined protein interfaces.
Davis FP, Sali A. Davis FP, et al. Bioinformatics. 2005 May 1;21(9):1901-7. doi: 10.1093/bioinformatics/bti277. Epub 2005 Jan 18. Bioinformatics. 2005. PMID: 15657096 - Predicting co-complexed protein pairs from heterogeneous data.
Qiu J, Noble WS. Qiu J, et al. PLoS Comput Biol. 2008 Apr 18;4(4):e1000054. doi: 10.1371/journal.pcbi.1000054. PLoS Comput Biol. 2008. PMID: 18421371 Free PMC article. - Solvated docking: introducing water into the modelling of biomolecular complexes.
van Dijk AD, Bonvin AM. van Dijk AD, et al. Bioinformatics. 2006 Oct 1;22(19):2340-7. doi: 10.1093/bioinformatics/btl395. Epub 2006 Aug 9. Bioinformatics. 2006. PMID: 16899489 - Predicting 3D structures of protein-protein complexes.
Vakser IA, Kundrotas P. Vakser IA, et al. Curr Pharm Biotechnol. 2008 Apr;9(2):57-66. doi: 10.2174/138920108783955209. Curr Pharm Biotechnol. 2008. PMID: 18393862 Review.
Cited by
- Protomers of protein hetero-oligomers tend to resemble each other more than expected.
Carugo O. Carugo O. Springerplus. 2014 Nov 20;3:680. doi: 10.1186/2193-1801-3-680. eCollection 2014. Springerplus. 2014. PMID: 26034682 Free PMC article. - Sequence-based identification of interface residues by an integrative profile combining hydrophobic and evolutionary information.
Chen P, Li J. Chen P, et al. BMC Bioinformatics. 2010 Jul 28;11:402. doi: 10.1186/1471-2105-11-402. BMC Bioinformatics. 2010. PMID: 20667087 Free PMC article. - Flexible Backbone Assembly and Refinement of Symmetrical Homomeric Complexes.
Roy Burman SS, Yovanno RA, Gray JJ. Roy Burman SS, et al. Structure. 2019 Jun 4;27(6):1041-1051.e8. doi: 10.1016/j.str.2019.03.014. Epub 2019 Apr 18. Structure. 2019. PMID: 31006588 Free PMC article. - Geometric description of self-interaction potential in symmetric protein complexes.
Empereur-Mot C, Garcia-Seisdedos H, Elad N, Dey S, Levy ED. Empereur-Mot C, et al. Sci Data. 2019 May 17;6(1):64. doi: 10.1038/s41597-019-0058-x. Sci Data. 2019. PMID: 31101822 Free PMC article. - QUATgo: Protein quaternary structural attributes predicted by two-stage machine learning approaches with heterogeneous feature encoding.
Tung CH, Chien CH, Chen CW, Huang LY, Liu YN, Chu YW. Tung CH, et al. PLoS One. 2020 Apr 29;15(4):e0232087. doi: 10.1371/journal.pone.0232087. eCollection 2020. PLoS One. 2020. PMID: 32348325 Free PMC article.
References
- Alberts B. The cell as a collection of protein machines: Preparing the next generation of molecular biologists. Cell. 1998;92:291–294. - PubMed
- Gavin AC, Aloy P, Grandi P, Krause R, Boesche M, et al. Proteome survey reveals modularity of the yeast cell machinery. Nature. 2006;440:631–636. - PubMed
- Berman HM, Battistuz T, Bhat TN, Bluhm WF, Bourne PE, et al. The Protein Data Bank. Acta Crystallogr D Biol Crystallogr. 2002;58:899–907. - PubMed
- Murzin AG, Brenner SE, Hubbard T, Chothia C. SCOP: A structural classification of proteins database for the investigation of sequences and structures. J Mol Biol. 1995;247:536–540. - PubMed
- Orengo CA, Michie AD, Jones S, Jones DT, Swindells MB, et al. CATH: A hierarchic classification of protein domain structures. Structure. 1997;5:1093–1108. - PubMed
Publication types
MeSH terms
Substances
LinkOut - more resources
Full Text Sources
Other Literature Sources


