Hedgehog/Ras interactions regulate early stages of pancreatic cancer - PubMed (original) (raw)
Hedgehog/Ras interactions regulate early stages of pancreatic cancer
Marina Pasca di Magliano et al. Genes Dev. 2006.
Abstract
Pancreatic ductal adenocarcinoma (PDA) constitutes a lethal disease that affects >30,000 people annually in the United States. Deregulation of Hedgehog signaling has been implicated in the pathogenesis of PDA. To gain insights into the role of the pathway during the distinct stages of pancreatic carcinogenesis, we established a mouse model in which Hedgehog signaling is activated specifically in the pancreatic epithelium. Transgenic mice survived to adulthood and developed undifferentiated carcinoma, indicating that epithelium-specific Hedgehog signaling is sufficient to drive pancreatic neoplasia but does not recapitulate human pancreatic carcinogenesis. In contrast, simultaneous activation of Ras and Hedgehog signaling caused extensive formation of pancreatic intraepithelial neoplasias, the earliest stages of human PDA tumorigenesis, and accelerated lethality. These results indicate the cooperation of Hedgehog and Ras signaling during the earliest stages of PDA formation. They also mark Hedgehog pathway components as relevant therapeutic targets for both early and advanced stages of pancreatic ductal neoplasia.
Figures
Figure 1.
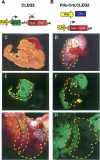
Pdx-Cre;CLEG2 mice develop pancreatic cancer. (A) Schematic of the CLEG2 transgene. In the absence of Cre expression, the constitutively active CAG promoter drives expression of EGFP in multiple organs. Under these conditions a polyA sequence with strong termination signal inhibits transcription of the GLI2ΔN transgene located 3′ of the EGFP cDNA. The EGFP cDNA is flanked by loxP sites (triangles). (B) The CLEG2 transgenic mouse was crossed with transgenic Pdx1-Cre animals to initiate recombination within the whole pancreatic epithelium of Pdx-Cre;CLEG2 bitransgenic mice. Cre-mediated excision of the floxed _EGFP_-stop cassette results in transcription of the GLI2ΔN transgene. The myc tag present at the 5′ end of the myc/Gli2ΔN fusion protein allows immunohistochemical detection of the transgene. (C) Gross morphology of the pancreas in a control single-transgenic CLEG2 mouse. The pancreas, nestled between the stomach, the spleen, and the duodenum, is outlined with a yellow dashed line. (D) The size and gross morphology of Pdx-Cre;CLEG2 pancreas (outlined in yellow) is comparable to control. (E) Stomach, duodenum, and pancreas express GFP in a CLEG2 mouse. The fluorescence in the pancreas appears especially intense due to the light color and density of the organ. (F) The expression of GFP is retained in the stomach and duodenum of Pdx-Cre;CLEG2 mice, but it is absent from the pancreas, indicating tissue-specific Cre recombination. A fluorescent lymph node within the pancreas is indicated with an arrow. Note that different exposure times were used for E and F due to the strong fluorescence of the pancreas in CLEG2 mice. (G) Tumor (outlined in yellow) invading the abdominal cavity of a 4-mo-old Pdx-Cre;CLEG2 mouse. (H) UV light picture of the same tumor demonstrates absence of EGFP expression, consistent with recombination of the CLEG2 transgene. The surrounding organs remain EGFP positive.
Figure 2.
Tumors in Pdx-Cre;CLEG2 mice are undifferentiated. (A) A massive tumor (in a 12-wk-old mouse), firmly attached to the gastrointestinal organs, has invaded the abdominal cavity and impaired the digestive process. (B) Histological section through a representative tumor (the tumor border is marked by a dashed yellow line). Note the prominent vascular space (v) and the pronounced necrotic area (n). (C) High magnification of tumor cells. Tumor cells are undifferentiated and have enlarged nuclei and scant cytoplasm. Ductal structures are not observed. (D) Acinar–ductal replacement is observed in the periphery of the tumor (white arrows). The tumor border is marked by a yellow dashed line. Note the presence of remnants of acinar cells within the ducts. (E) Immunohistochemistry for myc. Tumor cells show strong nuclear staining (outlined in yellow). A subset of cells in ducts undergoing acinar–ductal replacement exhibits moderate level of myc expression (arrows). (F) Staining for CK19. Tumor tissue (border marked in yellow) is negative, whereas a duct adjacent to the tumor is strongly positive.
Figure 3.
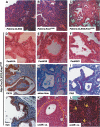
Histology of lesions and tumors observed in Pdx-Cre;CLEG2;KrasG12D mice. (A,B) Low-magnification images of the pancreas of 6-wk-old Pdx-Cre;CLEG2 (A) and Pdx-Cre;KrasG12D (B) mice. The composition and structure of the pancreas appears normal. (C) Low-magnification image showing the pancreas histology of a 6-wk-old Pdx-Cre;CLEG2;KrasG12D mouse. The normal pancreas morphology has been replaced by an extensive network of dilated ducts that are interspersed by fibrotic areas. Acinar cells that constitute the majority of cells in a normal pancreas are almost completely lost. (D–F) Formation of PanIN lesions in Pdx-Cre;CLEG2;KrasG12D pancreata. (D) PanIN1A lesions composed of characteristic goblet cells with basal nuclei and abundant intracellular mucin. (E) PanIN1B lesions. The epithelial cells show somewhat enlarged nuclei. (F) PanIN2/PanIN3 lesions with papillary growth and higher nuclear/cytoplasmic ratio of the tumor cells. (G) Most duct cells within PanIN lesions are positive for CK19. Subsets of cell clusters have lost CK19 expression and show altered polarity (arrowheads). (H,I) Epithelial cells within PanIN lesions show mucin accumulation as marked by alcian blue (H) and PAS (I) stainings. (J) Detection of the GLI2ΔN/myc fusion protein in a PanIN lesion by immunohistochemistry with an anti-myc-tag antibody. (K,L) Invasive tumors. (K) Undifferentiated carcinoma (outlined in yellow). Polygonal-to-spindle tumor cells show solid growth and surround a duct (d). (L) High-magnification picture of tumor cells. Tumor cells with high nuclear/cytoplasmic ratio form a solid pattern. Mitotic figures are indicated by arrows.
Figure 4.
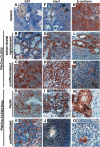
Characterization of gene expression in lesions and tumors from Pdx-Cre;CLEG2 and Pdx-Cre;CLEG2;KrasG12D mice. (A–E) Proliferating cells are detected with immunostaining against ki67. (A) Control pancreas. Increased proliferation is observed in both acinar–ductal replacement (B) and tumors (C) in Pdx-Cre;CLEG2 mice. (D,E) PanIN lesion (D) and undifferentiated tumor (E) in Pdx-Cre;CLEG2;KrasG12D pancreata. (F) Hes1 labels centroacinar cells but not duct cells in adult pancreas (arrowheads). (d) Duct; (v) blood vessel. (G,H) Elevated Hes1 levels in proliferating ducts (G) and tumor cells (H) in a Pdx-Cre;CLEG2 mouse. (I) Hes1 expression is up-regulated in a PanIN lesions (I) and poorly differentiated tumors (J) in a Pdx-Cre;CLEG2;KrasG12D mouse. (K) Membrane-associated E-cadherin expression in control pancreas. (L,N) Membrane E-cadherin is retained in the areas of acinar–ductal replacement of the Pdx-Cre; CLEG2 mice as well as in PanINs of Pdx-Cre;CLEG2;KrasG12D animals. (M,O) E-cadherin expression is lost in the undifferentiated areas of both Pdx-Cre;CLEG2 and Pdx-Cre;CLEG2;KrasG12D tumors.
Figure 5.
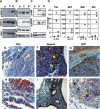
Hedgehog/Ras signaling and desmoplasia in Pdx-Cre;CLEG2 and Pdx-Cre;CLEG2;KrasG12D mice. (A) Western blot shows activation of the MAPK pathway, measured as elevated levels of phospho-ERK1/2, in the PanIN lesions of Pdx-Cre;CLEG2;KrasG12D mice (K). Phospho-ERK1/2 is barely detectable in control pancreas (p) and tumor tissue isolated from Pdx-Cre;CLEG2 mice (C). In all cases, no significant difference is observed in the total amount of ERK1/2. GAPDH (abbreviated as GAP) served as loading control. (B) Western blot analysis shows overexpression of phosphorylated PDK1 and AKT in transgenic tissue compared with control pancreas. The total AKT protein levels are unchanged. (C) Elevated levels of phospho-EGFR (active form) in Pdx-Cre;CLEG2 (C), and Pdx-Cre; CLEG2;KrasG12D (K) animals compared with wild-type pancreas (p). Similarly, phospho-s6k is increased in transgenic samples compared with control pancreas. Total AKT and GAPDH protein levels are unchanged. (D) Expression of Hedgehog signaling components. Quantitative PCR shows significantly increased levels of Ptc1 and Gli1 in Pdx-Cre;CLEG2 (C) and in _Pdx_-Cre;CLEG2;KrasG12D mice (K) compared with wild-type pancreas tissue (p). Quantitative PCR analysis of Shh expression confirms that Shh levels are undetectable in normal pancreas and in tumors from Pdx-Cre;CLEG2 mice. In contrast, expression is significantly increased in the PanIN lesions of Pdx-Cre; CLEG2;KrasG12D mice. Similarly, Ihh expression is elevated in Pdx-Cre; CLEG2;KrasG12D samples (K) but not in Pdx-Cre;CLEG2 (C). Control pancreas samples are labeled as “p.” (E,H) Immunohistochemical analysis confirms Shh expression in Pdx-Cre;CLEG2;KrasG12D (E) but not in Pdx-Cre;CLEG2 acinar–ductal replacement areas or tumors (H). (F,I) Gomori trichrome staining indicates little stromal infiltration in Pdx-Cre;CLEG2 tumors. Ducts are outlined in yellow. (F) In contrast, extensive fibrosis reaction, marked by green Gomori staining, is observed in mesenchyme surrounding PanIN lesions in Pdx-Cre;CLEG2;KrasG12D animals (I). (G) ki67 staining indicates lack of proliferation in the mesenchymal area (outlined in yellow) surrounded by a Pdx-Cre;CLEG2 tumor. Note that ki67-positive cells are found within the tumor tissue (bottom part of the picture). (J) In contrast, proliferative activity is observed in the stroma of a Pdx-Cre;CLEG2;KrasG12D pancreas. The border of the epithelium is outlined in yellow; some ki67-positive nuclei in stromal cells are indicated by arrows.
Similar articles
- Stromal response to Hedgehog signaling restrains pancreatic cancer progression.
Lee JJ, Perera RM, Wang H, Wu DC, Liu XS, Han S, Fitamant J, Jones PD, Ghanta KS, Kawano S, Nagle JM, Deshpande V, Boucher Y, Kato T, Chen JK, Willmann JK, Bardeesy N, Beachy PA. Lee JJ, et al. Proc Natl Acad Sci U S A. 2014 Jul 29;111(30):E3091-100. doi: 10.1073/pnas.1411679111. Epub 2014 Jul 14. Proc Natl Acad Sci U S A. 2014. PMID: 25024225 Free PMC article. - Sonic hedgehog acts at multiple stages during pancreatic tumorigenesis.
Morton JP, Mongeau ME, Klimstra DS, Morris JP, Lee YC, Kawaguchi Y, Wright CV, Hebrok M, Lewis BC. Morton JP, et al. Proc Natl Acad Sci U S A. 2007 Mar 20;104(12):5103-8. doi: 10.1073/pnas.0701158104. Epub 2007 Mar 19. Proc Natl Acad Sci U S A. 2007. PMID: 17372229 Free PMC article. - Nicotine promotes initiation and progression of KRAS-induced pancreatic cancer via Gata6-dependent dedifferentiation of acinar cells in mice.
Hermann PC, Sancho P, Cañamero M, Martinelli P, Madriles F, Michl P, Gress T, de Pascual R, Gandia L, Guerra C, Barbacid M, Wagner M, Vieira CR, Aicher A, Real FX, Sainz B Jr, Heeschen C. Hermann PC, et al. Gastroenterology. 2014 Nov;147(5):1119-33.e4. doi: 10.1053/j.gastro.2014.08.002. Epub 2014 Aug 12. Gastroenterology. 2014. PMID: 25127677 - Ductal neoplasia of the pancreas: nosologic, clinicopathologic, and biologic aspects.
Adsay NV, Basturk O, Cheng JD, Andea AA. Adsay NV, et al. Semin Radiat Oncol. 2005 Oct;15(4):254-64. doi: 10.1016/j.semradonc.2005.04.001. Semin Radiat Oncol. 2005. PMID: 16183479 Review. - Hedgehog Signaling in Pancreatic Fibrosis and Cancer.
Bai Y, Bai Y, Dong J, Li Q, Jin Y, Chen B, Zhou M. Bai Y, et al. Medicine (Baltimore). 2016 Mar;95(10):e2996. doi: 10.1097/MD.0000000000002996. Medicine (Baltimore). 2016. PMID: 26962810 Free PMC article. Review.
Cited by
- Genetically engineered mouse models of pancreatic adenocarcinoma.
Guerra C, Barbacid M. Guerra C, et al. Mol Oncol. 2013 Apr;7(2):232-47. doi: 10.1016/j.molonc.2013.02.002. Epub 2013 Feb 11. Mol Oncol. 2013. PMID: 23506980 Free PMC article. Review. - Hypoxia triggers hedgehog-mediated tumor-stromal interactions in pancreatic cancer.
Spivak-Kroizman TR, Hostetter G, Posner R, Aziz M, Hu C, Demeure MJ, Von Hoff D, Hingorani SR, Palculict TB, Izzo J, Kiriakova GM, Abdelmelek M, Bartholomeusz G, James BP, Powis G. Spivak-Kroizman TR, et al. Cancer Res. 2013 Jun 1;73(11):3235-47. doi: 10.1158/0008-5472.CAN-11-1433. Epub 2013 Apr 30. Cancer Res. 2013. PMID: 23633488 Free PMC article. - Common activation of canonical Wnt signaling in pancreatic adenocarcinoma.
Pasca di Magliano M, Biankin AV, Heiser PW, Cano DA, Gutierrez PJ, Deramaudt T, Segara D, Dawson AC, Kench JG, Henshall SM, Sutherland RL, Dlugosz A, Rustgi AK, Hebrok M. Pasca di Magliano M, et al. PLoS One. 2007 Nov 7;2(11):e1155. doi: 10.1371/journal.pone.0001155. PLoS One. 2007. PMID: 17982507 Free PMC article. - Context-dependent regulation of the GLI code in cancer by HEDGEHOG and non-HEDGEHOG signals.
Stecca B, Ruiz i Altaba A. Stecca B, et al. J Mol Cell Biol. 2010 Apr;2(2):84-95. doi: 10.1093/jmcb/mjp052. Epub 2010 Jan 17. J Mol Cell Biol. 2010. PMID: 20083481 Free PMC article. Review. - Tracking down the hedgehog's lair in the pancreas.
Maitra A. Maitra A. Gastroenterology. 2010 Mar;138(3):823-5. doi: 10.1053/j.gastro.2010.01.021. Epub 2010 Jan 25. Gastroenterology. 2010. PMID: 20100446 Free PMC article. No abstract available.
References
- Almoguera, C., Shibata, D., Forrester, K., Martin, J., Arnheim, N., Perucho, M. Most human carcinomas of the exocrine pancreas contain mutant c-K-ras genes. Cell. 1988;53:549–554. - PubMed
- Androutsellis-Theotokis, A., Leker, R.R., Soldner, F., Hoeppner, D.J., Ravin, R., Poser, S.W., Rueger, M.A., Bae, S.K., Kittappa, R., McKay, R.D. Notch signalling regulates stem cell numbers in vitro and in vivo. Nature. 2006;442:823–826. - PubMed
- Apelqvist, A., Ahlgren, U., Edlund, H. Sonic hedgehog directs specialised mesoderm differentiation in the intestine and pancreas. Curr. Biol. 1997;7:801–804. - PubMed
- Apelqvist, A., Li, H., Sommer, L., Beatus, P., Anderson, D.J., Honjo, T., de Hrabe Angelis, M., Lendahl, U., Edlund, H. Notch signalling controls pancreatic cell differentiation. Nature. 1999;400:877–881. - PubMed
Publication types
MeSH terms
Substances
Grants and funding
- P30 CA82103/CA/NCI NIH HHS/United States
- P30 DK063720/DK/NIDDK NIH HHS/United States
- P30 CA046592/CA/NCI NIH HHS/United States
- DK60533-01A1/DK/NIDDK NIH HHS/United States
- R01 DK060533/DK/NIDDK NIH HHS/United States
- R01 CA112537/CA/NCI NIH HHS/United States
- P30 CA082103/CA/NCI NIH HHS/United States
- P30 DK63720/DK/NIDDK NIH HHS/United States
- R01 AR045973/AR/NIAMS NIH HHS/United States
- R01 CA087837/CA/NCI NIH HHS/United States
- AR45973/AR/NIAMS NIH HHS/United States
- R01 CA087837-02S1/CA/NCI NIH HHS/United States
- CA112537-01/CA/NCI NIH HHS/United States
- R01 CA087837-07/CA/NCI NIH HHS/United States
- CA87837/CA/NCI NIH HHS/United States
LinkOut - more resources
Full Text Sources
Other Literature Sources
Medical
Molecular Biology Databases


