FAPP2, cilium formation, and compartmentalization of the apical membrane in polarized Madin-Darby canine kidney (MDCK) cells - PubMed (original) (raw)
FAPP2, cilium formation, and compartmentalization of the apical membrane in polarized Madin-Darby canine kidney (MDCK) cells
Otilia V Vieira et al. Proc Natl Acad Sci U S A. 2006.
Abstract
We have analyzed the role of the phosphatidylinositol-4-phosphate adaptor protein-2 (FAPP2), a component of the apical transport machinery, in cilium formation in polarized Madin-Darby canine kidney (MDCK) cells. We show that ciliogenesis is defective in FAPP2 knockdown cells. Furthermore, by using fluorescence recovery after photobleaching studies of domain connectivity and the generalized polarization spectra of Laurdan, we demonstrate that FAPP2 depletion impairs the formation of condensed apical membrane domains. Laurdan staining also revealed that the ciliary membrane has a highly condensed bilayer domain at its base that could function as a fence to separate the ciliary membrane from the surrounding apical membrane. These results indicate that the compartmentalization of the apical membrane in MDCK cells into the ciliary membrane and the surrounding membrane depends on the balance of raft and nonraft domains.
Conflict of interest statement
The authors declare no conflict of interest.
Figures
Fig. 1.
FAPP2 is required for ciliogenesis. Primary cilia on filter-grown MDCK cells and on Matrigel cysts. MDCK cells were grown at confluence for 4 or 7 days on Transwell filters (A_–_C) or Matrigel (D_–_F), respectively, and then processed for IF. Cilia were labeled with an antibody to acetylated tubulin to reveal the ciliary axoneme (A, B, D, and E, red) and with DAPI to stain the nucleus (D and E, blue). (C and F) Quantification of the effect of FAPP2 depletion on cilia formation on filter-grown MDCK cells and cysts, respectively. Data are means ± SE of three separate experiments. A and D and black columns in C and F are controls. B and E and white columns in C and F are KD cells. (Scale bars, 10 μm.)
Fig. 2.
FAPP2 depletion causes an accumulation of subapical vesicles. (A_–_F) Distribution of apical (A and B, podocalyxin, red), subapical (C and D, galectin-3), and basolateral (A and B, green, E-cadherin; E and F, gp58) markers in control (A, C, and E) and FAPP2-KD cells (B, D, and F). (G and H) Electron micrographs of control (G) and KD cells (H). H also shows the zoom in of the microtubule-organizing center region. The cells were grown at confluence for 1 day on Transwell filters and then processed for indirect immunofluorescence or for EM. (Scale bars, 10 μm.)
Fig. 3.
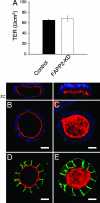
FAPP2 depletion induces morphological changes in the apical lumen of cysts. (A) The transepithelial resistance (TER, graph) was determined in filter-grown cells as described in Materials and Methods. The cells were seeded on polycarbonate filters for 4 days. The black column corresponds to control, and the white column corresponds to KD cells. Data are means ± SE of three separate experiments. (B_–_E) KD and control cells were suspended in Matrigel and cultured in the matrix for 4–7 days. The cysts were fixed and processed. Confocal sections passing through the middle of each cyst are shown. Whereas >60% of the KD cells (C) had formed cysts with a collapsed apical lumen, as visualized by actin staining with TRITC-phalloidin (red) and nuclear staining with DAPI (blue), only 20% of control cells (B) displayed a collapsed lumen. Apical (podocalyxin, red) and basolateral (gp58, green) distribution in control (D) and FAPP2-KD (E) cells is shown. (Scale bars, 10 μm.)
Fig. 4.
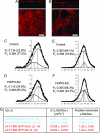
FAPP2 depletion changes the physical state of the apical plasma membrane. (A and B) Forssman glycolipid distribution in filter-grown control (A) and KD (B) cells. (Scale bars, 10 μm.) (C_–_F) Control (C and E) and FAPP-2 KD (D and F) cells were plated onto coverslips at a density of 100 × 103 per 2 cm2, grown to confluent monolayers for 24 h, Laurdan labeled, and stained for apical marker protein podocalyxin (C and D) or basolateral marker gp58 (E and F). The distributions of ≈12 GP images from a single experiment taken at a focal depth corresponding to either apical or basolateral membranes were normalized and fitted to two Gaussian populations (black line through data). The fit yielded in a fluid population (Pf, dark gray) and a more ordered population (Po, light gray). The mean GP of these populations as well as the coverage of the population (corresponding to the area under the curves) is given in each subpanel. Erfs for C_–_F are 0.0031, 0.0025, 0.0049, and 0.0018, respectively. (G) Table showing the diffusion coefficient, D, and the fraction that recovered in FRAP experiments on control and FAPP2-KD cells. Values are presented as averages ± 1 SD for the nonraft marker protein (EGFR-TMD-GFP in blue) and the raft marker protein (LAT-TMD-GFP in red). A circular spot of 4-μm2 area was bleached on the apical membrane, and the fluorescence recovery due to diffusion was recorded at room temperature. The raw experimental data were corrected for bleaching during the recording, normalized, and fitted to a 2D diffusion model (12, 13). The number of FRAP curves n used for the theoretical analysis is given by n = xy, where x is the number of independent experiments, and y is the average number of cells examined per experiment.
Fig. 5.
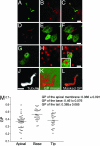
The ciliary membrane has a condensed lipid domain at its base. (A, D, and J) Primary cilia revealed by using an antibody to acetylated tubulin. (B) FGL distribution. (C) FGL labels both apical membrane and cilia. (E and G) YFP-GL-GPI distribution. (F) YFP-GL-GPI is excluded from the center of the apical membrane that corresponds to the site of outgrowth of the primary cilium (red). (H) Galec tin-3 distribution. (I) Galectin-3 is confined to a subdomain of the apical membrane surrounding the site of outgrowth of the primary cilium. (J_–_L) Filter-grown MDCK cells were fixed and simultaneously imaged for the Laurdan intensity and acetylated tubulin. For Laurdan intensity, images were converted to GP images (K) as described in Materials and Methods. (Scale bars, 10 μm.) (M) GP values at apical membrane domain (▴, n = 39), base (▾, n = 28), and tip (♦, n = 28) of cilia were determined for individual images. Means (indicated by horizontal lines) and SDs are indicated in the graph.
Comment in
- Vesicle transport, cilium formation, and membrane specialization: the origins of a sensory organelle.
Reiter JF, Mostov K. Reiter JF, et al. Proc Natl Acad Sci U S A. 2006 Dec 5;103(49):18383-4. doi: 10.1073/pnas.0609324103. Epub 2006 Nov 28. Proc Natl Acad Sci U S A. 2006. PMID: 17132734 Free PMC article. Review. No abstract available.
Similar articles
- FAPP2 is involved in the transport of apical cargo in polarized MDCK cells.
Vieira OV, Verkade P, Manninen A, Simons K. Vieira OV, et al. J Cell Biol. 2005 Aug 15;170(4):521-6. doi: 10.1083/jcb.200503078. J Cell Biol. 2005. PMID: 16103222 Free PMC article. - FAPP2 is required for aquaporin-2 apical sorting at trans-Golgi network in polarized MDCK cells.
Yui N, Okutsu R, Sohara E, Rai T, Ohta A, Noda Y, Sasaki S, Uchida S. Yui N, et al. Am J Physiol Cell Physiol. 2009 Dec;297(6):C1389-96. doi: 10.1152/ajpcell.00098.2009. Epub 2009 Sep 30. Am J Physiol Cell Physiol. 2009. PMID: 19794145 - Depletion of apical transport proteins perturbs epithelial cyst formation and ciliogenesis.
Torkko JM, Manninen A, Schuck S, Simons K. Torkko JM, et al. J Cell Sci. 2008 Apr 15;121(Pt 8):1193-203. doi: 10.1242/jcs.015495. Epub 2008 Mar 18. J Cell Sci. 2008. PMID: 18349078 - Membrane rafting: from apical sorting to phase segregation.
Coskun U, Simons K. Coskun U, et al. FEBS Lett. 2010 May 3;584(9):1685-93. doi: 10.1016/j.febslet.2009.12.043. Epub 2009 Dec 28. FEBS Lett. 2010. PMID: 20036659 Review. - Vesicle transport, cilium formation, and membrane specialization: the origins of a sensory organelle.
Reiter JF, Mostov K. Reiter JF, et al. Proc Natl Acad Sci U S A. 2006 Dec 5;103(49):18383-4. doi: 10.1073/pnas.0609324103. Epub 2006 Nov 28. Proc Natl Acad Sci U S A. 2006. PMID: 17132734 Free PMC article. Review. No abstract available.
Cited by
- Differential recognition of lipid domains by two Gb3-binding lectins.
Schubert T, Sych T, Madl J, Xu M, Omidvar R, Patalag LJ, Ries A, Kettelhoit K, Brandel A, Mely Y, Steinem C, Werz DB, Thuenauer R, Römer W. Schubert T, et al. Sci Rep. 2020 Jun 16;10(1):9752. doi: 10.1038/s41598-020-66522-8. Sci Rep. 2020. PMID: 32546842 Free PMC article. - Scoring a backstage pass: mechanisms of ciliogenesis and ciliary access.
Garcia-Gonzalo FR, Reiter JF. Garcia-Gonzalo FR, et al. J Cell Biol. 2012 Jun 11;197(6):697-709. doi: 10.1083/jcb.201111146. J Cell Biol. 2012. PMID: 22689651 Free PMC article. Review. - The AP-1 clathrin adaptor facilitates cilium formation and functions with RAB-8 in C. elegans ciliary membrane transport.
Kaplan OI, Molla-Herman A, Cevik S, Ghossoub R, Kida K, Kimura Y, Jenkins P, Martens JR, Setou M, Benmerah A, Blacque OE. Kaplan OI, et al. J Cell Sci. 2010 Nov 15;123(Pt 22):3966-77. doi: 10.1242/jcs.073908. Epub 2010 Oct 27. J Cell Sci. 2010. PMID: 20980383 Free PMC article. - Regulation of developmental intercellular signalling by intracellular trafficking.
Shilo BZ, Schejter ED. Shilo BZ, et al. EMBO J. 2011 Aug 31;30(17):3516-26. doi: 10.1038/emboj.2011.269. EMBO J. 2011. PMID: 21878993 Free PMC article. Review. - Physical basis for the determination of lumen shape in a simple epithelium.
Vasquez CG, Vachharajani VT, Garzon-Coral C, Dunn AR. Vasquez CG, et al. Nat Commun. 2021 Sep 23;12(1):5608. doi: 10.1038/s41467-021-25050-3. Nat Commun. 2021. PMID: 34556639 Free PMC article.
References
- Yeaman C, Grindstaff KK, Nelson WJ. Physiol Rev. 1999;79:73–98. - PubMed
- Praetorius HA, Spring KR. Annu Rev Physiol. 2005;67:515–529. - PubMed
- Pazour GJ, Witman GB. Curr Opin Cell Biol. 2003;15:105–110. - PubMed
Publication types
MeSH terms
Substances
LinkOut - more resources
Full Text Sources
Molecular Biology Databases


