NAADP induces pH changes in the lumen of acidic Ca2+ stores - PubMed (original) (raw)
NAADP induces pH changes in the lumen of acidic Ca2+ stores
Anthony J Morgan et al. Biochem J. 2007.
Abstract
NAADP (nicotinic acid-adenine dinucleotide phosphate)-induced Ca2+ release has been proposed to occur selectively from acidic stores in several cell types, including sea urchin eggs. Using fluorescence measurements, we have investigated whether NAADP-induced Ca2+ release alters the pH(L) (luminal pH) within these acidic stores in egg homogenates and observed their prompt, concentration-dependent alkalinization by NAADP (but not beta-NAD+ or NADP). Like Ca2+ release, the pH(L) change was desensitized by low concentrations of NAADP suggesting it was secondary to NAADP receptor activation. Moreover, this was a direct effect of NAADP upon the acidic stores and not secondary to increases in cytosolic Ca2+ as it was not mimicked by IP3 (inositol 1,4,5-trisphosphate), cADPR (cyclic adenine diphosphoribose), ionomycin, thapsigargin or by direct addition of Ca2+, and was not blocked by EGTA. The results of the present study further support acidic stores as targets for NAADP and for the first time reveal an adjunct role for NAADP in regulating the pH(L) of intracellular organelles.
Figures
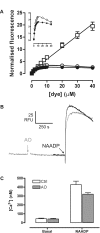
Figure 1. Characterization of pHL dyes in vitro and effects upon NAADP-dependent Ca2+ release
(A) Increasing concentrations of fluorescein (□), Acridine Orange (○) and Lysosensor™ Green DND-189 (●) were added to GluIM (pH 5.0) in a cuvette and the fluorescence was measured. Fluorescence at each concentration is expressed as a fraction of the fluorescence at the 1 μM value for each dye, and the inset depicts a magnified view of the Acridine Orange and Lysosensor™ Green DND-189 values with the same units for the ordinate and abscissa. Results are expressed as means±S.E.M. for six separate determinations. (B) Effect of Acridine Orange upon NAADP-induced Ca2+ release in homogenates, as measured with Fura-2. NAADP responses in the absence (black trace) or presence (grey trace) of 10 μM Acridine Orange (AO) added where indicated. (C) Bar graph summarizing the results of (B), showing means±S.E.M. of seven experiments.
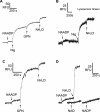
Figure 2. Characterization of the pHL of acidic Ca2+ stores
Sea urchin egg homogenates were loaded with 1–10 μM Acridine Orange (A,C and D) or 10 μM Lysosensor™ Green DND-189 (B). Homogenates were treated with 1 μM NAADP, 1 μM β-NAD+, 1 μM NADP, 100 μM GPN, 10 mM NH4Cl or 2 μM nigericin (Nig) where indicated. Traces are representative of at least three preparations.
Figure 3. Valinomycin is required for an FCCP-induced alkalinization
FCCP (2 μM) and valinomycin (10 μM) were added to Acridine Orange-loaded homogenates where indicated (A and B). (C) Summarizes the fluorescence changes in (A) and (B) and shows the means±S.E.M. for 7 or 8 experiments. Open bars refer to the protocol in (A) (FCCP addition first), whereas the closed bars refer to the protocol in (B) (FCCP added second).
Figure 4. Effect of bafilomycin A1 upon NAADP-evoked pHL changes
Bafilomycin A1 (1 μM), NAADP (1 μM) and NH4Cl (10 mM) were added to Acridine Orange-labelled homogenates where indicated (A and B). Traces are drawn on a common scale depicted in (A). (C) Summarizes the changes in fluorescence (Δ_F_) in (A) and (B), and are shown as the means±S.E.M. of 9–12 determinations expressed as a percentage of the maximal NH4Cl response. Baf Postinc, responses when bafilomycin A1 was added after NAADP; Baf Preinc, responses when bafilomycin A1 was added before NAADP.
Figure 5. Effect of membrane potential, H+ leak and V-ATPase activity on pHL
(A, B and C) Fluorescence traces of homogenates labelled with 10 μM Acridine Orange (AO). Addition of AO, 100 nM FCCP (F), 1 μM bafilomycin A1 (B or Baf), 10 μM valinomycin (V or Val) and 10 mM NH4Cl were effected where shown. The bar charts show means±S.E.M. for 8–10 experiments for the amplitudes (D) and initial kinetics (E) of the respective responses. Amplitudes are expressed as the change in fluorescence (Δ_F_) as a percentage of the maximum change with NH4Cl and rates as fluorescence units/s (U/s).
Figure 6. Characterization of NAADP receptor-mediated pHL responses
(A) Traces of Acridine Orange fluorescence in homogenates illustrating the relationship between pHL and NAADP concentration (10, 30, 100 and 1000 nM). (B) Summarizes the data in (A), showing the means±S.E.M. of 7 or 8 experiments normalized to the final 10 mM NH4Cl response. To investigate the effect of self-inactivation, traces depict typical Acridine Orange responses to 1 μM NAADP alone (C) or after desensitisation by incubation with 5 nM NAADP (D) on a common time scale (see bar) and normalized to the maximal and minimum responses. (E) Shows amplitudes (means±S.E.M.) of responses to 1 μM NAADP alone (Ctrl, open bar), 5 nM NAADP alone (filled bar, Desens), and 1 μM NAADP subsequent to 5 nM NAADP (filled bar, Desens); results are expressed as a percentage of the final 10 mM NH4Cl response for 7–12 experiments.
Figure 7. Ca2+ release from the ER does not mimic NAADP-induced pHL responses
pHL was measured in Acridine Orange-labelled homogenates in response to application of 10 μM cADPR (A), 4 μM IP3 (B), 5 μM ionomycin (Iono) (C) or 1 μM thapsigargin (Tg) (D). NAADP was subsequently applied at 1 μM (C and D). (E) Shows the means±S.E.M. of responses to the agents alone as indicated; all observations were normalized to 10 mM NH4Cl for 5–28 experiments.
Figure 8. Relationship between extravesicular [Ca2+] and pHL
(A) Sequential boluses of 1–100 μM Ca2+ were applied directly to homogenates in the cuvette and extravesicular [Ca2+] changes were measured with Fluo-3. (B) Corresponding pHL trace measured in homogenates labelled with Acridine Orange in response to incremental Ca2+, 5 mM EGTA and 10 mM NH4Cl. (C) Relationship between [Ca2+] changes determined with Fluo-3 in (A) and corresponding pHL changes measured with Acridine Orange in (B). Open circles (○) represent bolus additions of Ca2+, the grey triangle those associated with 1 μM NAADP in the same preparation. Results are means±S.E.M. for 8 (NAADP) and 31 experiments (Ca2+). (D) clamping cytosolic Ca2+ with 5 mM EGTA produces a fall in pHL, but does not block the alkalinization induced by 1 μM NAADP (_n_=13). (B and D) Inset panels show hypothetical Ca2+ and H+ movements for orientation.
Similar articles
- Nicotinate adenine dinucleotide phosphate (NAADP) triggers a specific calcium release system in sea urchin eggs.
Chini EN, Beers KW, Dousa TP. Chini EN, et al. J Biol Chem. 1995 Feb 17;270(7):3216-23. doi: 10.1074/jbc.270.7.3216. J Biol Chem. 1995. PMID: 7852407 - Interactions between intracellular Ca2+ stores: Ca2+ released from the NAADP pool potentiates cADPR-induced Ca2+ release.
Chini EN. Chini EN. Braz J Med Biol Res. 2002 May;35(5):543-7. doi: 10.1590/s0100-879x2002000500005. Braz J Med Biol Res. 2002. PMID: 12011938 - NAADP induces Ca2+ oscillations via a two-pool mechanism by priming IP3- and cADPR-sensitive Ca2+ stores.
Churchill GC, Galione A. Churchill GC, et al. EMBO J. 2001 Jun 1;20(11):2666-71. doi: 10.1093/emboj/20.11.2666. EMBO J. 2001. PMID: 11387201 Free PMC article. - NAADP-induced calcium release in sea urchin eggs.
Galione A, Patel S, Churchill GC. Galione A, et al. Biol Cell. 2000 Jul;92(3-4):197-204. doi: 10.1016/s0248-4900(00)01070-4. Biol Cell. 2000. PMID: 11043408 Review. - NAADP receptors.
Galione A, Ruas M. Galione A, et al. Cell Calcium. 2005 Sep-Oct;38(3-4):273-80. doi: 10.1016/j.ceca.2005.06.031. Cell Calcium. 2005. PMID: 16111747 Review.
Cited by
- A New Perspective of Lysosomal Cation Channel-Dependent Homeostasis in Alzheimer's Disease.
Ezeani M, Omabe M. Ezeani M, et al. Mol Neurobiol. 2016 Apr;53(3):1672-1678. doi: 10.1007/s12035-015-9108-3. Epub 2015 Feb 18. Mol Neurobiol. 2016. PMID: 25691454 Review. - TPCs: Endolysosomal channels for Ca2+ mobilization from acidic organelles triggered by NAADP.
Zhu MX, Ma J, Parrington J, Galione A, Evans AM. Zhu MX, et al. FEBS Lett. 2010 May 17;584(10):1966-74. doi: 10.1016/j.febslet.2010.02.028. Epub 2010 Feb 14. FEBS Lett. 2010. PMID: 20159015 Free PMC article. Review. - Two-pore channels: going with the flows.
Morgan AJ, Martucci LL, Davis LC, Galione A. Morgan AJ, et al. Biochem Soc Trans. 2022 Aug 31;50(4):1143-1155. doi: 10.1042/BST20220229. Biochem Soc Trans. 2022. PMID: 35959977 Free PMC article. - Calcium- and polyphosphate-containing acidic granules of sea urchin eggs are similar to acidocalcisomes, but are not the targets for NAADP.
Ramos IB, Miranda K, Pace DA, Verbist KC, Lin FY, Zhang Y, Oldfield E, Machado EA, De Souza W, Docampo R. Ramos IB, et al. Biochem J. 2010 Aug 1;429(3):485-95. doi: 10.1042/BJ20091956. Biochem J. 2010. PMID: 20497125 Free PMC article. - NAADP-Mediated Ca2+ Signalling.
Galione A, Davis LC, Martucci LL, Morgan AJ. Galione A, et al. Handb Exp Pharmacol. 2023;278:3-34. doi: 10.1007/164_2022_607. Handb Exp Pharmacol. 2023. PMID: 35879580
References
- Burdakov D., Petersen O. H., Verkhratsky A. Intraluminal calcium as a primary regulator of endoplasmic reticulum function. Cell Calcium. 2005;38:303–310. - PubMed
- Missiaen L., Raeymaekers L., Dode L., Vanoevelen J., Van Baelen K., Parys J. B., Callewaert G., De Smedt H., Segaert S., Wuytack F. SPCA1 pumps and Hailey–Hailey disease. Biochem. Biophys. Res. Commun. 2004;322:1204–1213. - PubMed
- Galione A., Ruas M. NAADP receptors. Cell Calcium. 2005;38:273–280. - PubMed
- Yamasaki M., Masgrau R., Morgan A. J., Churchill G. C., Patel S., Ashcroft S. J., Galione A. Organelle selection determines agonist-specific Ca2+ signals in pancreatic acinar and beta cells. J. Biol. Chem. 2004;279:7234–7240. - PubMed
Publication types
MeSH terms
Substances
LinkOut - more resources
Full Text Sources
Miscellaneous


