Vesicular glutamate transporter 2 is required for central respiratory rhythm generation but not for locomotor central pattern generation - PubMed (original) (raw)
Comparative Study
Vesicular glutamate transporter 2 is required for central respiratory rhythm generation but not for locomotor central pattern generation
Asa Wallén-Mackenzie et al. J Neurosci. 2006.
Abstract
Glutamatergic excitatory neurotransmission is dependent on glutamate release from presynaptic vesicles loaded by three members of the solute carrier family, Slc17a6-8, which function as vesicular glutamate transporters (VGLUTs). Here, we show that VGLUT2 (Slc17a6) is required for life ex utero. Vglut2 null mutant mice die immediately after birth because of the absence of respiratory behavior. Investigations at embryonic stages revealed that neural circuits in the location of the pre-Bötzinger (PBC) inspiratory rhythm generator failed to become active. However, neurons with bursting pacemaker properties and anatomical integrity of the PBC area were preserved. Vesicles at asymmetric synapses were fewer and malformed in the Vglut2 null mutant hindbrain, probably causing the complete disruption of AMPA/kainate receptor-mediated synaptic activity in mutant PBC cells. The functional deficit results from an inability of PBC neurons to achieve synchronous activation. In contrast to respiratory rhythm generation, the locomotor central pattern generator of Vglut2 null mutant mice displayed normal rhythmic and coordinated activity, suggesting differences in their operating principles. Hence, the present study identifies VGLUT2-mediated signaling as an obligatory component of the developing respiratory rhythm generator.
Figures
Figure 1.
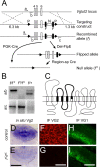
Gene targeting of the Vglut2 locus results in specific loss of VGLUT2 protein expression. A, The gene targeting strategy shows exons 4, 5, 6 in the Vglut2 locus flanked by a 5′ loxP (P) site and a 3′ Frt (F)-flanked Neo (N) cassette followed by a second loxP site in the targeting construct and the resulting recombined allele (f). A 6.3 kb 5′ arm and a 1.3 kb 3′ arm were used for homologous recombination sequence. The locations of PCR-oligos used for genotyping are labeled with a, b, and c; a, CTGTCCACCTTTGTATCCCA; b, GCAATCACATTTCACTGTTC; c, CACACCCACTCCACTTGAGG. General Cre-mediated recombination using PGK-Cre mice (PCre) (Lallemand et al., 1998) results in a null allele designated Vglut2f;PCre (f c). Deleter-FlpE (Del-FlpE)-mediated recombination removes the Neo cassette, and region-specific (sp) Cre-mediated deletion results in a region-specific null allele. B, PCR primer combination a+b (top) results in a 150 bp band corresponding to the wt allele (+), a 184 bp band to the f allele, and no band to the f c allele, whereas a+c (bottom) results in a 327 bp band in the f c allele and no band in the f and + alleles. The f/f c genotype thus results in 184 and 327 bp bands, the f c/f c genotype in a 327 bp band, and the f/+ genotype in 150 and 184 bp bands. C, Schematic drawing of the VGLUT2 protein structure including 12 transmembrane domains and interconnecting loops of which transmembrane domains 3, 4, 5, and part of 6, and loops 3, 4, and 5 (thick line) are deleted after Cre-mediated recombination. D_–_I, In situ hybridization and immunofluorescence (IF) expression analysis in control and Vglut2f/f;PCre brains shows strong Vglut2 mRNA (D) and protein (F) in control thalamus and a weak mRNA expression but complete absence of protein, in the same region in the Vglut2f/f;PCre brain. VGLUT1 protein expression was normal in the hippocampus of control and Vglut2f/f;PCre embryos (H, I). Scale bars: E, 1.3 mm; G, 160 μm; I, μm.
Figure 2.
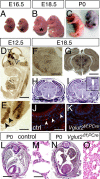
Vglut2 is expressed early in the embryo and is essential for normal development. A_–_C, Vglut2f/f;PCre embryos (*) appear arrested in development and can be distinguished from control littermates already at E16.5 by their hunched posture (A). At E18.5 (B), their smaller size (weights: control, 1. ± 0.03 g, n = 49; Vglut2f/f;PCre, 1.20 ± 0.03 g, n = 20; p = 0.0269) is easily distinguished at P0. C, The pups display cyanosis and die directly after birth. D, E, Vglut2 in situ hybridization of E12.5 embryos reveals strong mRNA expression in distinct brain regions (D), such as the ventral and dorsal diencephalon and ventral mesencephalon (arrows), brainstem, spinal cord, and dorsal root ganglia (close-up in E, marked with arrows) and also along the telencephalic and fourth ventricles and the aqueduct. F, G, Vglut2 continues to be strongly expressed in the brainstem (F) and the thalamus during late development (G). H, I, Hematoxylin/eosin staining of control (H) and Vglut2f/f;PCre embryos (I) coronal sections at E18.5 shows grossly normal brain histology of the null mutant compared with control, except a few animals (n = 4/9, E18.5 and P0) that displayed enlarged appearance of ventricles (e.g., third ventricle) (inset in I). J, K, VGLUT2-positive nerve terminals (red) are readily detected by immunofluorescence (nuclear costaining with DAPI in blue) in control internal organs at E18.5, as shown here in transverse sections of the muscular wall of the esophagus (J), whereas these nerve terminals are undetectable in the null mutants (K). L_–_O, Hematoxylin/eosin staining of transverse sections of control and Vglut2f/f;PCre P0 bodies shows grossly normal histology of the mutant compared with control except in the lungs, where the control display normal alveolar appearance (close-up in M), whereas an immature, noninflated structure is manifest in the mutant (close-up in O). Scale bars: D, 1 mm; E, 0.25 mm; F, 730 μm; G, 0.3 mm; H, 1.7 mm; I, inset, 0.5 mm; J, 45 μm; L, 2 mm; M, 40 μm.
Figure 3.
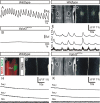
Vglut2f/f;PCre mutants do not breathe and fail to generate a central respiratory-like rhythm. A, B, Plethysmographic recordings of spontaneous ventilation in E18.5 fetuses 1 min after surgical delivery. All control fetuses (A) showed robust respiratory cycles with alternating inspiratory (upward deflections) and expiratory (downward deflections) phases, whereas all Vglut2f/f;PCre mutants (B) did not show any sign of ventilation. C, D, Photomicrographs of a whole E16.5 wt hindbrain preparation (ventral side up, rostral at top) used to visualize fluorescence changes (D) occurring spontaneously and synchronously in the left (l) and right (r) facial motor nuclei (white outlines 7m,l and 7m,r in C). E, Corresponding fluorescence changes (Δ_F_/F) after loading whole hindbrain isolated preparation with Calcium Green-1AM are shown superposed to the hypoglossal nerve (12n) integrated neurogram (bottom trace). Note rhythmic fluorescence changes of facial motoneurons phased to the hypoglossal nerve root electrical activity. F, Photomicrograph of a whole-mount hindbrain preparation double immunostained for NK1R (red) and the motorneuron marker Islet1,2 (green) demonstrates that the position of the right facial motor nucleus matches the location of the fluorescence changes presented in D. G, Bath application of 10 μ
m
CNQX to a wt whole-mount hindbrain preparation suppressed both rhythmic calcium changes over the facial motor nuclei (G, H) and accompanying electrical activity of the 12n (H, bottom trace). I, The Vglut2f/f;PCre mutants showed normal hindbrain morphology (I) but never displayed calcium transients over the facial motor nuclei (J) nor electrical hypoglossal motor activity (K).
Figure 4.
Vglut2f/f;PCre embryos lack a functional PBC rhythmogenic neural network. A, B, Direct and relative fluorescence photomicrographs of a transverse medulla slice from an E16.5 wt embryo. A suction electrode (δ) was used to record the PBC population electrical activity (δ) (C, D, top trace). Loading of the calcium indicator Calcium Green-1AM was used to record the associated relative increase in fluorescence (Δ_F_/F) (C, D, bottom trace) of the left PBC region (black circle). Note the correlation between bursts of electrical activity and calcium transients characterizing the PBC rhythmic activity in control (C) and after bath application of the excitatory neuromodulator SP (D). E, F, In the Vglut2f/f;Pcre mutant, no sign of electrical or optical organized activity could be noticed in control condition (G) or induced by bath application of SP (H).
Figure 5.
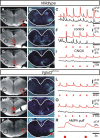
Excitatory commissural communication between PBC ventrolateral areas is impaired in E16.5 Vglut2f/f;PCre mutant transverse slices. Communication between bilaterally located PBCs through commissural projections was compared in wt (A_–_I) and Vglut2f/f;PCre mutants (J_–_O). A_–_C, Direct fluorescence image (A) showing the position of the stimulation electrode (S1) over the right PBC and regions used to detect calcium changes over the stimulated PBC (red outline) and the contralateral PBC (black outline). B, Evoked relative calcium change over the slice in response to S1. C, Fluorescence (Δ_F_/F) traces color matched to regions shown in A. The top red trace in C corresponds to calcium transients (upward arrowheads) occurring in red outlined region of the PBC ipsilateral to the stimulus. Note in the wt the bilateral activation of dorsomedial regions. Synchronous ipsilateral and contralateral (black trace) PBC-evoked responses are intermixed with spontaneous rhythmic activity in wt slices (D_–_F). In contrast, evoked activity fails contralaterally in the Vglut2f/f;PCre mutant (J_–_L), which are also spontaneously inactive. D_–_F, Stimulation over the midline commissure (S2) in wt slices evoked a local (red trace) and a bilateral response of the PBC (black trace; left PBC response) as well as activation of dorsomedial regions of the slice in the vicinity of hypoglossal motorneurons. In corresponding Vglut2f/f;PCre mutant slices (M_–_O), the PBC-evoked response to S2 (O, black trace) shows a considerably reduced amplitude reminiscent of that obtained in the wt context after application of CNQX (G, H). P_–_R, Pressure application of AMPA over the right PBC area in Vglut2f/f;PCre mutant (Q, R, red squares) evoked a calcium response restricted to the immediate vicinity of the injection site (R, red trace), thus failing to orthodromically propagate to the contralateral PBC area (R, black trace).
Figure 6.
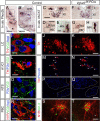
Respiratory-related nuclei in the brainstem appear normal in the Vglut2f/f;PCre mutant. A, B, Phox2b in situ hybridization on coronal sections of E18.5 wt embryos shows the locations of several nuclei involved in regulation of respiratory function including the LC (A), the NTS (B), and the A1/C1 noradrenergic/adrenergic nucleus (A1/C1) (B). C_–_H, VAChT in situ hybridization on adjacent section shows the location of other respiratory-related nuclei; the dorsal nucleus of the vagus nerve (X), the hypoglossal nucleus (XII) (both on C), the ambiguous nucleus (NA) (D), and the anterior spinal motor neurons (MN) (E). In the Vglut2f/f;PCre, these nuclei appear normal (F, X and XII; G, NA; H, MN). Note, in D, the approximate area of the PBC is boxed to visualize its location; however, this is a VAChT-negative nucleus. I_–_T, Immunofluorescence analyses with specific markers of the respiratory nuclei at E18.5 shown in A and B, in which the left panel shows the location of VGLUT2-positive terminals (green) in the LC (I, colabeling with TH in red and DAPI in blue), A1/C1 [L, TH in red and Phox2b (P2b) in blue], NTS (O, P2b in blue), and also the PBC [R, neurokinin-1-receptor (N1R) in red and DAPI in blue]. The middle and right panels show the entire nuclei at lower magnification; NTS with TH in red (J, K), A1C1 with TH in red and Phox2b in blue (M, N), NTS with Phox2b in blue (P, Q), and PBC and NA visceral motor neurons with N1R in red and islet1,2 in green (S, T) in the control (J, M, P, S) and Vglut2f/f;PCre (K, N, Q, T) brains. No major structural differences between the two genotypes could be detected in these nuclei. In particular, note in S and T the conserved organization of the PBC area including NK1R+/islet1,2- interneurons (white arrowheads) ventral and medial to the NA. Scale bars: A, 410 μm; B, 320 μm; C, 270 μm; D, 230 μm; E, 72 μm; I, 13 μm; K, 75 μm; L, 9 μm; N, 35 μm; O, 21 μm; R, 13 μm; Q, 150 μm; T, 50 μm.
Figure 7.
Loss of VGLUT2 results in the selective absence of fast excitatory synaptic events in neurons of the PBC area. A_–_D, Voltage-clamp whole-cell recordings of spontaneous inward synaptic currents in rhythmically active PBC neurons recorded in a wt E16.5 transverse slice and in nonrhythmic neurons of the PBC area recorded in a Vglut2f/f;PCre mutant slice (E_–_H). A, Current traces showing in a representative wt neuron a characteristic mixture of fast (black triangles) and slow (empty triangles) inward synaptic events. B, Ten superposed individual synaptic currents (top traces) are averaged (bottom trace) and fitted to derive the time constant of their decay respectively for fast (left set of traces) and slow (right set of traces) synaptic events. C, The bimodal frequency distribution of the decay time constant of synaptic events (n = 440) featuring a first peak corresponding to fast decaying events (black triangle); slow, white triangle above the histogram in that cell. D, The presence of bicuculline and strychnine blocking chloride-mediated synaptic currents suppressed all slow synaptic events and left the fast events unaffected. In the Vglut2f/f;PCre mutant neurons (E_–_H), almost all synaptic events were slow (E, F); fast synaptic events were found to be extremely scarce (<3%; see the histogram in G) resulting in a modal distribution of the decay time constants of all synaptic events (n = 460) in the slow event range (white triangle above histogram). Furthermore, blocking of GABAA and glycine receptors suppressed all slow events (H). All current measurements were performed at a holding potential of −70 mV.
Figure 8.
Neurons with intrinsic bursting properties are present in the PBC area of Vglut2f/f;PCre mutants. A_–_C, Direct (A) and relative (B) fluorescence image at a cellular resolution (60× objective) of the PBC area in Vglut2f/f;PCre mutant transverse slices in control conditions. The changes in fluorescence were derived from the areas outlined around eight cells numbered 1–8 (A) and are presented in C. Calcium transients in cell 8 (A, red outline) are periodic, whereas cell 3 (A, blue outline) shows a single calcium event. The relative fluorescence image (B) taken at the time indicated by an arrowhead in C illustrate that cell 3 is active when remaining cells are inactive. The average calcium signal (C, bottom thick trace) for the eight cells is flat, demonstrating the lack of synchronous calcium events. D, In the presence of SP (0.1 μ
m
), cells 3, 5, and 8 show increased number of bursts. Note that, in cell 3, bursts are organized in a periodic manner under SP. Flat average signal (D, bottom thick average trace) indicates that absence of synchronous calcium events is maintained under SP. E, Whole-cell current-clamp experiment showing the membrane potential (Vm) trajectory (top trace) of a neuron recorded in the PBC area in a Vglut2f/f;PCre mutant transverse slice and simultaneous population activity recording of the PBC area (D, bottom trace). At a hyperpolarized potential of −64 mV, this neuron is inactive; at its resting membrane potential (Vrest., −55 mV), it generates bursts of action potential (one such burst indicated by the arrowhead is shown with a faster time base in F); and when further depolarized to −50 mV, the bursts show increased duration and are generated at a higher frequency.
Figure 9.
Loss of VGLUT2 results in altered morphology and reduced number of synaptic vesicles in asymmetric synapses. A, VGLUT2 immunofluoresence (white) of the E18.5 brainstem showing the area selected for EM quantification (square). B_–_E, High-magnification pictures show that asymmetric vesicles in the Vglut2f/f;PCre (B_–_D) are highly irregular in shape as exemplified here by thin (B) and thick (C) elongated vesicles and a couple of drop-shaped and pointed vesicles (D), whereas the control vesicles show a regular, circular shape (E). The white arrows indicate vesicle borders. F_–_I, Low magnification of synaptic structures containing presynaptic vesicles shows that symmetrical synapses, defined by thickened presynaptic and postsynaptic membranes, do not differ between control (F) and Vglut2f/f;PCre (G), whereas asymmetric synapses, with thickened postsynaptic membrane in both genotypes, contain round vesicles in the control (H) and irregularly shaped vesicles in the Vglut2f/f;PCre (I). J, K, Quantification of the number of vesicles per synapse, subdivided into groups of 1, 2–8, 9–18, 19–25, or >25 vesicles per synapse, in symmetrical (J) and asymmetrical (K) synapses in brainstem of two control and two Vglut2f/f;PCre E18.5 embryos. In symmetrical synapses, the resulting profiles do not differ significantly between controls and mutants; both have similar number of synapses in each subgroup. In contrast, the profiles of asymmetrical synapses differ in that 30–50% of synapses contain one vesicle only in the Vglut2f/f;PCre brain, whereas no control synapses belong to this subgroup. Instead, control synapses contain a larger number of vesicles (8% have 19–25 vesicles and up to 13% have >25 vesicles), whereas the corresponding number in the mutant for both these subgroups is zero. Scale bars: A, 155 μm; C, 50 nm; H, 175 nm.
Figure 10.
Preserved rhythmic and coordinated locomotor activity in the lumbar spinal cord of Vglut2f/f;PCre mutant mice. A_–_C, Vglut in situ hybridization on transverse wt sections of spinal cord shows expression at E12.5 (A) and P0 (B) of Vglut2 mRNA widely distributed, whereas Vglut1 mRNA is discretely expressed in the P11 dorsal spinal cord (C). D, G, Recorded activity in the lumbar ventral roots, at level 2 and 5, after application of NMDA and serotonin to the isolated spinal cord of E18.5 mice. The control (D) as well as the Vglut2f/f;PCre mutant spinal cords (G) show a normal alternating rhythmic locomotor activity. E, F, H, I, Circular phase diagrams of intrasegmental left/right (E, H) and intersegmental flexion/extension (F, I) coordination. A phase value of 0.5 reflects alternating activity, and 0.0 reflects synchronous activity. l, Left; r, right; L, lumbar segment. J, The average period cycle time of control (n = 11) and Vglut2f/f;PCre (n = 7) mice was not statistically different (p = 0.0680); the average was calculated from the mean period of 15 random locomotor cycles from each mouse. Error bars indicate SEM.
Similar articles
- Role of glutamate in locomotor rhythm generating neuronal circuitry.
Gezelius H, Wallén-Mackenzie A, Enjin A, Lagerström M, Kullander K. Gezelius H, et al. J Physiol Paris. 2006 Nov-Dec;100(5-6):297-303. doi: 10.1016/j.jphysparis.2007.05.001. Epub 2007 Jun 2. J Physiol Paris. 2006. PMID: 17618093 - Identification of minimal neuronal networks involved in flexor-extensor alternation in the mammalian spinal cord.
Talpalar AE, Endo T, Löw P, Borgius L, Hägglund M, Dougherty KJ, Ryge J, Hnasko TS, Kiehn O. Talpalar AE, et al. Neuron. 2011 Sep 22;71(6):1071-84. doi: 10.1016/j.neuron.2011.07.011. Epub 2011 Sep 21. Neuron. 2011. PMID: 21943604 - Tlx3 and Tlx1 are post-mitotic selector genes determining glutamatergic over GABAergic cell fates.
Cheng L, Arata A, Mizuguchi R, Qian Y, Karunaratne A, Gray PA, Arata S, Shirasawa S, Bouchard M, Luo P, Chen CL, Busslinger M, Goulding M, Onimaru H, Ma Q. Cheng L, et al. Nat Neurosci. 2004 May;7(5):510-7. doi: 10.1038/nn1221. Epub 2004 Apr 4. Nat Neurosci. 2004. PMID: 15064766 - Genetic inactivation of the vesicular glutamate transporter 2 (VGLUT2) in the mouse: what have we learnt about functional glutamatergic neurotransmission?
Wallén-Mackenzie A, Wootz H, Englund H. Wallén-Mackenzie A, et al. Ups J Med Sci. 2010 Feb;115(1):11-20. doi: 10.3109/03009730903572073. Ups J Med Sci. 2010. PMID: 20187846 Free PMC article. Review. - The pre-Bötzinger oscillator in the mouse embryo.
Borday C, Vias C, Autran S, Thoby-Brisson M, Champagnat J, Fortin G. Borday C, et al. J Physiol Paris. 2006 Nov-Dec;100(5-6):284-9. doi: 10.1016/j.jphysparis.2007.05.007. Epub 2007 Jun 8. J Physiol Paris. 2006. PMID: 17628453 Review.
Cited by
- Architecture of the subthalamic nucleus.
Prasad AA, Wallén-Mackenzie Å. Prasad AA, et al. Commun Biol. 2024 Jan 10;7(1):78. doi: 10.1038/s42003-023-05691-4. Commun Biol. 2024. PMID: 38200143 Free PMC article. Review. - Sensorimotor function is modulated by the serotonin receptor 1d, a novel marker for gamma motor neurons.
Enjin A, Leão KE, Mikulovic S, Le Merre P, Tourtellotte WG, Kullander K. Enjin A, et al. Mol Cell Neurosci. 2012 Mar;49(3):322-32. doi: 10.1016/j.mcn.2012.01.003. Epub 2012 Jan 17. Mol Cell Neurosci. 2012. PMID: 22273508 Free PMC article. - Transient Suppression of Dbx1 PreBötzinger Interneurons Disrupts Breathing in Adult Mice.
Vann NC, Pham FD, Hayes JA, Kottick A, Del Negro CA. Vann NC, et al. PLoS One. 2016 Sep 9;11(9):e0162418. doi: 10.1371/journal.pone.0162418. eCollection 2016. PLoS One. 2016. PMID: 27611210 Free PMC article. - Distribution of vesicular glutamate transporters in the human brain.
Vigneault É, Poirel O, Riad M, Prud'homme J, Dumas S, Turecki G, Fasano C, Mechawar N, El Mestikawy S. Vigneault É, et al. Front Neuroanat. 2015 Mar 5;9:23. doi: 10.3389/fnana.2015.00023. eCollection 2015. Front Neuroanat. 2015. PMID: 25798091 Free PMC article. - Enhanced sucrose and cocaine self-administration and cue-induced drug seeking after loss of VGLUT2 in midbrain dopamine neurons in mice.
Alsiö J, Nordenankar K, Arvidsson E, Birgner C, Mahmoudi S, Halbout B, Smith C, Fortin GM, Olson L, Descarries L, Trudeau LÉ, Kullander K, Lévesque D, Wallén-Mackenzie A. Alsiö J, et al. J Neurosci. 2011 Aug 31;31(35):12593-603. doi: 10.1523/JNEUROSCI.2397-11.2011. J Neurosci. 2011. PMID: 21880920 Free PMC article.
References
- Bartlett D, Jr, Tenney SM. Control of breathing in experimental anemia. Respir Physiol. 1970;10:384–395. - PubMed
- Bellocchio EE, Reimer RJ, Fremeau RT, Jr, Edwards RH. Uptake of glutamate into synaptic vesicles by an inorganic phosphate transporter. Science. 2000;289:957–960. - PubMed
- Blanchi B, Kelly LM, Viemari JC, Lafon I, Burnet H, Bevengut M, Tillmanns S, Daniel L, Graf T, Hilaire G, Sieweke MH. MafB deficiency causes defective respiratory rhythmogenesis and fatal central apnea at birth. Nat Neurosci. 2003;6:1091–1100. - PubMed
- Borday V, Foutz AS, Nordholm L, Denavit-Saubie M. Respiratory effects of glutamate receptor antagonists in neonate and adult mammals. Eur J Pharmacol. 1998;348:235–246. - PubMed
Publication types
MeSH terms
Substances
LinkOut - more resources
Full Text Sources
Other Literature Sources
Molecular Biology Databases
