Substrate-specific translocational attenuation during ER stress defines a pre-emptive quality control pathway - PubMed (original) (raw)
Substrate-specific translocational attenuation during ER stress defines a pre-emptive quality control pathway
Sang-Wook Kang et al. Cell. 2006.
Abstract
Eukaryotic proteins entering the secretory pathway are translocated into the ER by signal sequences that vary widely in primary structure. We now provide a functional rationale for this long-observed sequence diversity by demonstrating that differences among signals facilitate substrate-selective modulation of protein translocation. We find that during acute ER stress, translocation of secretory and membrane proteins is rapidly and transiently attenuated in a signal sequence-selective manner. Their cotranslational rerouting to the cytosol for degradation reduces the burden of misfolded substrates entering the ER and represents a pathway for pre-emptive quality control (pQC). Bypassing the pQC pathway for the prion protein increases its rate of aggregation in the ER lumen during prolonged stress and renders cells less capable of viable recovery. Conversely, pharmacologically augmenting pQC during ER stress proved protective. Thus, protein translocation is a physiologically regulated process that is utilized for pQC as part of the ER stress response.
Figures
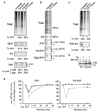
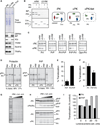
Figure 1. Signal Sequence-Specific Translocational Attenuation of PrP during Acute Stress
(A) Immunoprecipitation of transfected products (GFP, Prl, or PrP) from pulse-labeled (15 min) cultured HeLa cells treated for 30 min with 10 µM Tg or 10 mM DTT. Radiolabeled products recovered from stressed cells were quantified relative to untreated cells. For PrP, the amount of glycosylated species (+CHO) was also quantified separately. Asterisk is unglycosylated PrP. (B) The indicated constructs were analyzed as in (A), except COS-7 cells were used, labeling was for 10 min, and 100 µM ALLN (a proteasome inhibitor) was included. (C) PrP-Prl was analyzed and quantified as in (A). (D) Prl and PrP-Prl were immunoprecipitated from pulse-labeled transfected cells treated with 10 µM Tg in the presence of 10 µM MG132 (a proteasome inhibitor) as indicated. Note that PrP-Prl (but not Prl) generates signal sequence-containing precursor (+SS, indicative of nontranslocated protein) in a stress-dependent manner, illustrating its translocational attenuation. (E) Time course of recovery from translocational attenuation. COS-7 cells that were either untreated, acutely treated (30 min) with 10 mM DTT, or recovered for between 5 and 90 min were pulse labeled for 10 min and analyzed by immunoprecipitation of PrP. The efficiencies of glycosylation (solid line) and synthesis (dashed line) of either PrP (left graph) or Prl-PrP (right graph) relative to untreated cells are plotted.
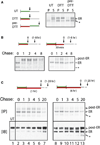
Figure 2. Terminal Misfolding of PrP during Prolonged ER Stress
(A) The left panel shows treatment protocols using N2a cells for 30 min pulse labeling (green bars) and 30 min treatment with 10 mM DTT (red bars) relative to harvesting (arrows) and analysis by solubility assays. PrP in the detergent-insoluble (P) and -soluble (S) fractions was recovered by immunoprecipitation and visualized by autoradiography. The core-glycosylated ER form and nonglycosylated species (*) of PrP are indicated. (B) Treatment protocols for labeling, DTT treatment, and chase (for 1–8 hr) prior to harvesting and immunoprecipitation are shown above the respective autoradiographs. Unglycosylated (*), core-glycosylated (ER), and complex glycosylated (post-ER) forms of PrP are indicated. (C) Cell lysates from the indicated treatment protocols were divided and analyzed for radiolabeled PrP by immunoprecipitation and autoradiography ([IP], top panels) or for total PrP by immunoblots ([IB], bottom panels).
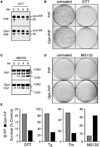
Figure 3. Consequences of Bypassing the pQC Pathway for PrP
(A) N2a cells stably expressing PrP or Opn-PrP were treated for 0–8 hr with 10 mM DTT and analyzed for total PrP by immunoblot. Note the increased accumulation of the ER form in Opn-PrP cells relative to PrP cells, especially obvious at the 4 hr time point. (B) Cells stably expressing PrP or Opn-PrP were treated with 10 mM DTT for 24 hr, replated in normal media, and visualized 10 days later by staining with crystal violet. (C) Cells stably expressing PrP or Opn-PrP were treated for 0–8 hr with 5 µM MG132 and analyzed for total PrP by immunoblot. Note the increased accumulation of unglycosylated species (−CHO) for PrP, but not for Opn-PrP. (D) Cells treated with 5 µM MG132 for 24 hr were replated in normal media and visualized 8 days later by staining with crystal violet. (E) Quantification of replating viability assays for survival of cells expressing PrP (gray bars) or Opn-PrP (black bars) after the indicated treatments for 24 hr (5 µM MG132), 6 hr (10 mM DTT), 18 hr (1 µg/ml Tunicamycin; Tm) or 5 min (5 µM Tg).
Figure 4. Pharmacologic Induction of pQC during Prolonged ER Stress Is Protective
(A) PrP and Opn-PrP cells were treated for 6 hr (5 µM CT, 5 µM MG132, and/or 0.1% DMSO) and analyzed by immunoblotting. The glycosylated (+CHO) and unglycosylated (−CHO) forms of PrP are indicated. (B) PrP and Opn-PrP cells treated for 12 hr with solvent (0.1% DMSO) or 5 µM CT were recovered in regular media for the indicated times and analyzed by immunoblotting for PrP. (C) PrP-expressing cells were treated for 4 hr with either 5 µM CT or 5 µM MG132, followed by trypsinization and replating in normal media for the indicated times before harvesting and analysis by immunoblotting. Diagram illustrating the experimental design is shown. (D) PrP-expressing cells treated for 12 hr as indicated were replated in normal media and visualized 10 days later by staining with crystal violet. Quantification of viability relative to control is indicated. (E) PrP and Opn-PrP cells treated for 24 hr as indicated were replated in normal media and visualized 10 days later by staining with crystal violet. Quantification of viability relative to control is indicated.
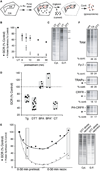
Figure 5. Analysis of Global Glycoprotein Biosynthesis during Acute ER Stress
(A) Experimental design. (B) HeLa cells treated with 10 mM DTT for the indicated times were pulse labeled (for 15 min), fractionated, and quantified to determine the glycoprotein-to-cytosolic protein ratio (GCR). The GCR at each time point (normalized to untreated cells) is plotted along with the overall level of protein synthesis (mean ± SD for three experiments). (C) Radiolabeled cytosolic proteins and glycoproteins from untreated and DTT-stressed (30 min) HeLa cells. Asterisks indicate bands that are minimally attenuated relative to other glycoproteins. (D) GCR (normalized to untreated cells analyzed in parallel) for HeLa cells acutely treated (for 30 min) with 10 µM Tg, 10 mM DTT, 10 µg/ml BFA, or 10 µM CT. Each point represents an individual experiment, with the gray bar showing the range observed. BFA* indicates treatment for 12 hr. (E) GCR (solid line) and overall translation (dotted line) was measured in cells pretreated for between 0 and 30 min with 10 mM DTT, or treated for 30 min followed by recovery in normal media for 0–30 min. Samples from time points shaded in gray are shown to the right. Note that during acute stress, many (but not all) glycoproteins are attenuated in their biosynthesis relative to the situation during recovery. (F) Analysis as in Figure 1A of Frizzled-7 (Fz7), TRAPα, CRF1 receptor (CRFR), and Prl-CRFR by pulse labeling and immunoprecipitation from transiently transfected cells treated for 30 min with 10 µM Tg or 10 mM DTT. Asterisks indicate nonglycosylated forms of each glycoprotein (except Frizzled-7, in which a nonglycosylated form was not detectable). The amount of the translocated and glycosylated form generated under each condition is quantified relative to untreated cells. The decrease in Frizzled-7 and TRAPα paralleled the level of translational attenuation caused by the stress.
Figure 6. Reconstitution of Signal Sequence-Specific Translocational Attenuation In Vitro
(A) Selective removal of lumenal proteins from rough microsomes (RM) by treatment with 0.075% deoxyBigCHAP. Equivalent aliquots of RM, the lumenal protein-depleted RM (LD-RM), and lumenal protein fraction were analyzed by Comassie staining (top) and immunoblots for various lumenal and membrane proteins (bottom). Although not seen in this blot, semiquantitative blotting showed ~80%–90% depletion of BiP and PDI (data not shown). (B) Analysis of LD-RM and mock-extracted RM (mRM) for vesicle integrity and orientation by a protease protection assay. LD-RM and mRM were digested with Proteinase K (PK) in the absence or presence of detergent (det; 0.5% Triton X-100) and analyzed by immunoblotting for the N terminus of calnexin (Cnx), BiP, and PDI. The N-terminal lumenal domain of Cnx is indicated by NTD. Asterisks indicate core domains of Cnx and PDI that are resistant to complete protease digestion. A schematic of the results is shown. (C) Analysis of protein translocation into mRM and LD-RM. The indicated constructs were translated in vitro without (−) or with membranes (either mRM or LD-RM) and analyzed for translocation by protease protection. Aliquots of the samples before and after PK digestion are shown. The relative translocation efficiency in LD-RM (relative to translocation in mRM) is indicated for each construct. All translation reactions contained a peptide inhibitor of glycosyation to simplify the analysis. (D) Analysis of protein translocation in RM and rRM (proteoliposomes reconstituted from a total membrane protein extract of RM) as in (C). An aliquot of the PrP samples was also immunoprecipitated with anti-PrP (+PK/IP) to better visualize the translocation products. Translocation efficiencies are given below the lanes. The positions of precursor and processed products for Prl and PrP are indicated. (E and F) The relative translocation efficiencies of the indicated constructs were analyzed in rRM and quantified from five experiments (mean ± SD). All constructs were translocated into RM with greater than 75% efficiency (data not shown). (G) Coomassie stain of rRM reconstituted in the presence of increasing concentrations of lumenal proteins. Note that the concentration of lumenal proteins incorporated into the rRM is low and does not approach that found in RM (Supplemental Data, Note 5). (H) Translocation of PrP and Prl was analyzed as in (D) using rRM containing increasing amounts of lumenal proteins. Note that in rRM, signal sequence cleavage is not complete, resulting in some translocation (and hence protease protection) of unprocessed protein. (I) The experiment in (H) was quantified, normalized to translocation in rRM (lacking lumenal proteins), and graphed.
Figure 7. Changes in Lumenal Chaperone Availability Accompany pQC
(A) The sizes of chaperone-containing complexes were analyzed in unstressed or acutely stressed (10 mM DTT for 30 min) HeLa cells by detergent extraction, fractionation by sucrose gradients, and immunoblotting (outlined on top). Note the decrease in BiP (and to a lesser extent, PDI) in the soluble fractions, with a corresponding increase in the insoluble fraction. The band slightly larger than Crt (*) is a background band that was inconsistently observed in some lanes. (B) Analysis of overloaded samples prepared as in (A) reveals increased amounts of BiP in both high-molecular-weight fractions (HMW) and previously described SDS-resistant complexes (**; see Marciniak et al. [2004]) in stressed cells relative to control cells. (C) The level of BiP in the insoluble fraction of HeLa cells acutely treated with 10 mM DTT for 30 min or treated and recovered for between 20 and 60 min. (D) The levels of various proteins were analyzed by immunoblotting in HeLa cells pretreated with 10 mM DTT for 1 hr followed by recovery for 18 hr. Triplicate samples are shown. Note induction of BiP and, to a lesser extent, PDI by the pretreatment protocol. (E) Cells were either left untreated or preconditioned with DTT as in (D). Subsequently, the levels of BiP, Cnx, and Crt in the soluble fractions (prepared as in [A]) were analyzed by immunoblotting before or after acute stress for 30 min with 10 µM Tg or 10 mM DTT. (F) Naive or DTT-preconditioned cells were analyzed for changes in GCR (mean ± SD for three replicates) upon acute ER stress for 15 min with 10mM DTT. The autoradiograph from a representative experiment is shown. (G) Naive or DTT-preconditioned cells were analyzed for changes in PrP translocation upon acute ER stress for 30 min with 10 mM DTT. Note that while naive cells showed translocational attenuation (as judged by decreased PrP glycosylation), preconditioned cells were largely refractory. Translational attenuation upon DTT stress was equal in both cells (data not shown). (H) Analysis of BiP-GFP translocation during acute stress. HeLa cells cotransfected with BiP-GFP and Prl-GFP (a constitutively translocated control) were subjected to 10 µM Tg or 10 mM DTT for 15 min prior to pulse labeling for 15 min. The cytosolic fraction was extracted with digitonin, and the noncytosolic (i.e., translocated) protein was recovered by immunoprecipitation with anti-GFP. Note that the level of translocated BiP-GFP during stress closely parallels Prl-GFP, indicating no obvious translocational attenuation. BiP-GFP translocation relative to Prl-GFP in the same cells was tabulated for three experiments and shown below the gel.
Comment in
- ER targeting signals: more than meets the eye?
Swanton E, High S. Swanton E, et al. Cell. 2006 Dec 1;127(5):877-9. doi: 10.1016/j.cell.2006.11.018. Cell. 2006. PMID: 17129773
Similar articles
- ER targeting signals: more than meets the eye?
Swanton E, High S. Swanton E, et al. Cell. 2006 Dec 1;127(5):877-9. doi: 10.1016/j.cell.2006.11.018. Cell. 2006. PMID: 17129773 - Reduced translocation of nascent prion protein during ER stress contributes to neurodegeneration.
Rane NS, Kang SW, Chakrabarti O, Feigenbaum L, Hegde RS. Rane NS, et al. Dev Cell. 2008 Sep;15(3):359-370. doi: 10.1016/j.devcel.2008.06.015. Dev Cell. 2008. PMID: 18804434 Free PMC article. - Pre-emptive Quality Control Protects the ER from Protein Overload via the Proximity of ERAD Components and SRP.
Kadowaki H, Nagai A, Maruyama T, Takami Y, Satrimafitrah P, Kato H, Honda A, Hatta T, Natsume T, Sato T, Kai H, Ichijo H, Nishitoh H. Kadowaki H, et al. Cell Rep. 2015 Nov 3;13(5):944-56. doi: 10.1016/j.celrep.2015.09.047. Epub 2015 Oct 22. Cell Rep. 2015. PMID: 26565908 - Translocation of proteins across the endoplasmic reticulum membrane.
Brodsky JL. Brodsky JL. Int Rev Cytol. 1998;178:277-328. doi: 10.1016/s0074-7696(08)62139-7. Int Rev Cytol. 1998. PMID: 9348672 Review. - The many functions of the endoplasmic reticulum chaperones and folding enzymes.
Halperin L, Jung J, Michalak M. Halperin L, et al. IUBMB Life. 2014 May;66(5):318-26. doi: 10.1002/iub.1272. Epub 2014 May 19. IUBMB Life. 2014. PMID: 24839203 Review.
Cited by
- The α-helical structure of prodomains promotes translocation of intrinsically disordered neuropeptide hormones into the endoplasmic reticulum.
Dirndorfer D, Seidel RP, Nimrod G, Miesbauer M, Ben-Tal N, Engelhard M, Zimmermann R, Winklhofer KF, Tatzelt J. Dirndorfer D, et al. J Biol Chem. 2013 May 17;288(20):13961-13973. doi: 10.1074/jbc.M112.430264. Epub 2013 Mar 26. J Biol Chem. 2013. PMID: 23532840 Free PMC article. - Differential age-dependent import regulation by signal peptides.
Teng YS, Chan PT, Li HM. Teng YS, et al. PLoS Biol. 2012;10(10):e1001416. doi: 10.1371/journal.pbio.1001416. Epub 2012 Oct 30. PLoS Biol. 2012. PMID: 23118617 Free PMC article. - Linking ER Stress to Autophagy: Potential Implications for Cancer Therapy.
Verfaillie T, Salazar M, Velasco G, Agostinis P. Verfaillie T, et al. Int J Cell Biol. 2010;2010:930509. doi: 10.1155/2010/930509. Epub 2010 Jan 17. Int J Cell Biol. 2010. PMID: 20145727 Free PMC article. - A signature in HIV-1 envelope leader peptide associated with transition from acute to chronic infection impacts envelope processing and infectivity.
Asmal M, Hellmann I, Liu W, Keele BF, Perelson AS, Bhattacharya T, Gnanakaran S, Daniels M, Haynes BF, Korber BT, Hahn BH, Shaw GM, Letvin NL. Asmal M, et al. PLoS One. 2011;6(8):e23673. doi: 10.1371/journal.pone.0023673. Epub 2011 Aug 18. PLoS One. 2011. PMID: 21876761 Free PMC article. - Preliminary X-ray crystallographic studies of mouse UPR responsive protein P58(IPK) TPR fragment.
Tao J, Wu Y, Ron D, Sha B. Tao J, et al. Acta Crystallogr Sect F Struct Biol Cryst Commun. 2008 Feb 1;64(Pt 2):108-10. doi: 10.1107/S1744309108000833. Epub 2008 Jan 31. Acta Crystallogr Sect F Struct Biol Cryst Commun. 2008. PMID: 18259061 Free PMC article.
References
- Besemer J, Harant H, Wang S, Oberhauser B, Marquardt K, Foster CA, Schreiner EP, de Vries JE, Dascher-Nadel C, Lindley IJ. Selective inhibition of cotranslational translocation of vascular cell adhesion molecule 1. Nature. 2005;436:290–293. - PubMed
- Drisaldi B, Stewart RS, Adles C, Stewart LR, Quaglio E, Biasini E, Fioriti L, Chiesa R, Harris DA. Mutant PrP is delayed in its exit from the endoplasmic reticulum, but neither wild-type nor mutant PrP undergoes retrotranslocation prior to proteasomal degradation. J. Biol. Chem. 2003;278:21732–21743. - PubMed
- Garrison JL, Kunkel EJ, Hegde RS, Taunton J. A substrate-specific inhibitor of protein translocation into the endoplasmic reticulum. Nature. 2005;436:285–289. - PubMed
Publication types
MeSH terms
Substances
LinkOut - more resources
Full Text Sources
Other Literature Sources
