Orchestration of lymphocyte chemotaxis by mitochondrial dynamics - PubMed (original) (raw)
Orchestration of lymphocyte chemotaxis by mitochondrial dynamics
Silvia Campello et al. J Exp Med. 2006.
Abstract
Lymphocyte traffic is required to maintain homeostasis and perform appropriate immunological reactions. To migrate into inflamed tissues, lymphocytes must acquire spatial and functional asymmetries. Mitochondria are highly dynamic organelles that distribute in the cytoplasm to meet specific cellular needs, but whether this is essential to lymphocyte functions is unknown. We show that mitochondria specifically concentrate at the uropod during lymphocyte migration by a process involving rearrangements of their shape. Mitochondrial fission facilitates relocation of the organelles and promotes lymphocyte chemotaxis, whereas mitochondrial fusion inhibits both processes. Our data substantiate a new role for mitochondrial dynamics and suggest that mitochondria redistribution is required to regulate the motor of migrating cells.
Figures
Figure 1.
Mitochondria accumulate at the uropod of polarized lymphocytes. (A–D) Distribution of mitochondria (mtRFP) in Jurkat T cells untreated (A and B) or polarized with 100 nM CXCL12 (C and D). 310 untreated and 395 polarized cells were analyzed. (B and D) Volume-rendered three-dimensional reconstructions of mitochondrial networks (see also Videos S1 and S2). (E–H) Distribution of mitochondria (mtRFP) in PB T cells resting (E and F) and polarized with 100 nM CCL21 (G and H). Staining of the uropod marker CD44 (blue) is shown. 59 resting and 45 polarized PB T cells were analyzed. Bars, 5 μm.
Figure 2.
Mitochondria accumulate at the uropod of a migrating leukocyte. _f_MLP-induced migration of dHL-60 cells expressing mtRFP and AKTPH-GFP monitored by time-lapse confocal microscopy. Images were taken at 5-s intervals. Representative images taken from the digital movie (Video S3) at the indicated times are shown. 14 cells expressing mtRFP and AKTPH-GFP were analyzed by real-time microscopy, and all of them showed a similar segregation of AKTPH-GFP to the leading edge and of mitochondria to the uropod. Bar, 5 μm.
Figure 3.
Specific accumulation of mitochondria in polarized leukocytes. (A and B) Distribution of mitochondria (mtRFP) and the endoplasmic reticulum (erGFP) in Jurkat T cells untreated (A) or polarized with 100 nM CXCL12 (B). (C) Distribution of mitochondria (mtRFP) and cytoplasm (GFP) in dHL-60 cells polarized with 100 nM _f_MLP. The fluorescence patterns reported in these panels were representative of at least 90% of the cells. Bars, 5 μm.
Figure 4.
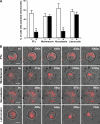
Mitochondria recruitment to the T cell uropod depends on Gi protein signaling and microtubule dynamics. Jurkat T cells expressing mtRFP were incubated with 1 μg/ml PTx, 100 nM wortmannin, 30 μM nocodazole, or 10 μM latrunculin, and polarization was induced with 100nM CXCL12. (A) Images of mtRFP fluorescence from randomly selected cells (78 cells in the PTx experiment, 84 cells in the wortmannin experiment, 85 cells in the nocodazole experiment, and 82 cells in the latrunculin experiment) were acquired, analyzed, and classified as described in Materials and methods. The analysis includes all the cells, and in all these experiments <12% of cells contained polarized mitochondria in the absence of the chemokine. The number of cells showing polarized shape was similar to the number of those showing polarized mitochondria in the case of PTx, wortmannin, and latrunculin experiments. When nocodazole was used, 35% of the cells were polarized. Data represent mean ± SE of at least three independent experiments. *, P ≤ 0.05 compared with control cells. (B) Representative images taken from the digital movie at the indicated times are shown. Images were taken at 5-s intervals. At least 10 cells were analyzed by real-time microscopy for each condition. Bars, 5 μm.
Figure 5.
Mitochondria fission is required for recruitment of the organelles to the cell uropod. Jurkat T cells were cotransfected with mtRFP and empty vector (A–C), mtRFP and DRP1 (D–F), or mtRFP and OPA1 (G–I), and mitochondrial shape in resting (A, B, D, E, G, and H) or polarized (C, F, and I) cells was analyzed by confocal microscopy. Bar graphs next to images in the figure indicate the frequency of the phenomenon represented. *, P ≤ 0.0001 compared with polarized control cells. When transfected with DRP1, 80% of 167 analyzed cells showed fragmented mitochondria as in E; after chemokine treatment, 61% of 150 cells showed the polarized phenotype shown in F. In contrast, when OPA1 was expressed, 65% of 169 analyzed cells showed fused mitochondria as in H, whereas 87% of 180 cells showed the impaired polarization in response to chemokine shown in I. In control cells (C), CXCL12 induced mitochondria polarization in 60% of 395 analyzed cells. (A, D, and G) Volume-rendered three-dimensional reconstructions of mitochondrial network (see also Videos S4, S5, and S6). Data represent mean ± SE. Bar, 5 μm.
Figure 6.
Lymphocyte polarization and migration is regulated by mitochondrial shape. Mitochondrial fusion-fission constrains lymphocyte polarization and migration. PB T lymphocytes were cotransfected with mtRFP and empty vector (control) or with mtRFP and wild-type MFN1, wild-type OPA1, dominant-negative OPA1 (K301A-OPA1), wild-type DRP1, or dominant-negative DRP1 (K38A-DRP1). T cells were exposed to a CXCL12 gradient, and transmigrated cells were counted. In all the experiments, the background migration was almost absent (<0.1% of the loaded cells did migrate in the absence of chemokines) and was not modified by mitochondria manipulation. Data are representative of at least three different experiments and are expressed as mean ± SE. *, P ≤ 0.05 compared with control cells.
Figure 7.
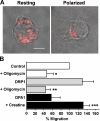
Mitochondrial ATP is required during T cell migration. (A) Oligomycin does not inhibit CXCL12-induced mitochondria redistribution to the Jurkat T cell uropod (88 cells analyzed). Bar, 5 μm. (B) Mitochondria respiration is limiting in chemotaxis. Control, DRP1-, or OPA1-overexpressing T cells were exposed to a CXCL12 gradient. After 2 h, transmigrated cells were counted. Where indicated, either Jurkat T cells were pretreated with 20 mM creatine or 0.4 μM oligomycin was added to the medium. Data are representative of three different experiments and are expressed as mean ± SE. *, P ≤ 0.05 compared with control cells; **, P ≤ 0.05 compared with untreated DRP1-overexpressing cells; ***, P ≤ 0.05 compared with untreated OPA1-overexpressing cells.
Figure 8.
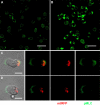
Mitochondrial ATP is required to sustain MLC phosphorylation. (A and B) Stimulation of T cells with chemokines induces MLC phosphorylation. PB T cells unstimulated (A) or polarized with CCL21 (B) were stained with anti-pMLC antibody and analyzed by confocal microscopy. Bars, 20 μm. (C and D) Inhibition of mitochondrial ATP production results in specific loss of MLC phosphorylation at the uropod. T cells expressing the mitochondrial marker mtRFP, pretreated (D) or not (C) with oligomycin, were stimulated with 100 nM CCL21, stained with anti-pMLC antibody, and analyzed by confocal microscopy. At least 50 cells were observed and analyzed for each condition. Bars, 5 μm.
Similar articles
- Mitochondrial redistribution: adding new players to the chemotaxis game.
Sánchez-Madrid F, Serrador JM. Sánchez-Madrid F, et al. Trends Immunol. 2007 May;28(5):193-6. doi: 10.1016/j.it.2007.03.007. Epub 2007 Apr 2. Trends Immunol. 2007. PMID: 17400511 - RALA and RALBP1 regulate mitochondrial fission at mitosis.
Kashatus DF, Lim KH, Brady DC, Pershing NL, Cox AD, Counter CM. Kashatus DF, et al. Nat Cell Biol. 2011 Aug 7;13(9):1108-15. doi: 10.1038/ncb2310. Nat Cell Biol. 2011. PMID: 21822277 Free PMC article. - COX assembly factor ccdc56 regulates mitochondrial morphology by affecting mitochondrial recruitment of Drp1.
Ban-Ishihara R, Tomohiro-Takamiya S, Tani M, Baudier J, Ishihara N, Kuge O. Ban-Ishihara R, et al. FEBS Lett. 2015 Oct 7;589(20 Pt B):3126-32. doi: 10.1016/j.febslet.2015.08.039. Epub 2015 Sep 7. FEBS Lett. 2015. PMID: 26358295 - (De)constructing mitochondria: what for?
Dimmer KS, Scorrano L. Dimmer KS, et al. Physiology (Bethesda). 2006 Aug;21:233-41. doi: 10.1152/physiol.00010.2006. Physiology (Bethesda). 2006. PMID: 16868312 Review. - New insights into the function and regulation of mitochondrial fission.
Otera H, Ishihara N, Mihara K. Otera H, et al. Biochim Biophys Acta. 2013 May;1833(5):1256-68. doi: 10.1016/j.bbamcr.2013.02.002. Epub 2013 Feb 20. Biochim Biophys Acta. 2013. PMID: 23434681 Review.
Cited by
- Deletion of the mitochondria-shaping protein Opa1 during early thymocyte maturation impacts mature memory T cell metabolism.
Corrado M, Samardžić D, Giacomello M, Rana N, Pearce EL, Scorrano L. Corrado M, et al. Cell Death Differ. 2021 Jul;28(7):2194-2206. doi: 10.1038/s41418-021-00747-6. Epub 2021 Mar 1. Cell Death Differ. 2021. PMID: 33649469 Free PMC article. - Nanoimaging granule dynamics and subcellular structures in activated mast cells using soft X-ray tomography.
Chen HY, Chiang DM, Lin ZJ, Hsieh CC, Yin GC, Weng IC, Guttmann P, Werner S, Henzler K, Schneider G, Lai LJ, Liu FT. Chen HY, et al. Sci Rep. 2016 Oct 17;6:34879. doi: 10.1038/srep34879. Sci Rep. 2016. PMID: 27748356 Free PMC article. - Mitochondria: signaling with phosphatidic acid.
Yang CY, Frohman MA. Yang CY, et al. Int J Biochem Cell Biol. 2012 Aug;44(8):1346-50. doi: 10.1016/j.biocel.2012.05.006. Epub 2012 May 15. Int J Biochem Cell Biol. 2012. PMID: 22609101 Free PMC article. Review. - Ectopic ATP synthase facilitates transfer of HIV-1 from antigen-presenting cells to CD4(+) target cells.
Yavlovich A, Viard M, Zhou M, Veenstra TD, Wang JM, Gong W, Heldman E, Blumenthal R, Raviv Y. Yavlovich A, et al. Blood. 2012 Aug 9;120(6):1246-53. doi: 10.1182/blood-2011-12-399063. Epub 2012 Jul 2. Blood. 2012. PMID: 22753871 Free PMC article. - From structure to function: mitochondrial morphology, motion and shaping in vascular smooth muscle.
McCarron JG, Wilson C, Sandison ME, Olson ML, Girkin JM, Saunter C, Chalmers S. McCarron JG, et al. J Vasc Res. 2013;50(5):357-71. doi: 10.1159/000353883. Epub 2013 Jul 24. J Vasc Res. 2013. PMID: 23887139 Free PMC article. Review.
References
- Lauffenburger, D.A., and A.F. Horwitz. 1996. Cell migration: a physically integrated molecular process. Cell. 84:359–369. - PubMed
- del Pozo, M.A., M. Nieto, J.M. Serrador, D. Sancho, M. Vicente-Manzanares, C. Martinez, and F. Sanchez-Madrid. 1998. The two poles of lymphocyte: specialized cell compartments for migration and recruitment. Cell Adhes. Commun. 6:125–133. - PubMed
- Griparic, L., and A.M. van der Bliek. 2001. The many shapes of mitochondrial membranes. Traffic. 2:235–244. - PubMed
- Morris, R.L., and P.J. Hollenbeck. 1993. The regulation of bidirectional mitochondrial transport is coordinated with axonal outgrowth. J. Cell Sci. 104:917–927. - PubMed
Publication types
MeSH terms
Substances
LinkOut - more resources
Full Text Sources
Other Literature Sources
Miscellaneous


