Probing the functional heterogeneity of surface binding sites by analysis of experimental binding traces and the effect of mass transport limitation - PubMed (original) (raw)
Probing the functional heterogeneity of surface binding sites by analysis of experimental binding traces and the effect of mass transport limitation
Juraj Svitel et al. Biophys J. 2007.
Abstract
Many techniques rely on the binding activity of surface-immobilized proteins, including antibody-based affinity biosensors for the detection of analytes, immunoassays, protein arrays, and surface plasmon resonance biosensors for the study of thermodynamic and kinetic aspects of protein interactions. To study the functional homogeneity of the surface sites and to characterize their binding properties, we have recently proposed a computational tool to determine the distribution of affinity and kinetic rate constants from surface binding progress curves. It is based on modeling the experimentally measured binding signal as a superposition of signals from binding to sites spanning a range of rate and equilibrium constants, with regularization providing the most parsimonious distribution consistent with the data. In the present work, we have expanded the scope of this approach to include a compartment-like transport step, which can describe competitive binding to different surface sites in a zone of depleted analyte close to the sensor surface. This approach addresses a major difficulty in the analysis of surface binding where both transport limitation as well as unknown surface site heterogeneity may be present. In addition to the kinetic binding parameters of the ensemble of surface sites, it can provide estimates for effective transport rate constants. Using antibody-antigen interactions as experimental model systems, we studied the effects of the immobilization matrix and of the analyte flow-rate on the effective transport rate constant. Both were experimentally observed to influence mass transport. The approximate description of mass transport by a compartment model becomes critical when applied to strongly transport-controlled data, and we examined the limitations of this model. In the presence of only moderate mass transport limitation the compartment model provides a good description, but this approximation breaks down for strongly transport-limited surface binding. In the latter regime, we report experimental evidence for the formation of gradients within the sensing volume of the evanescent field biosensor used.
Figures
FIGURE 1
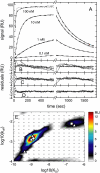
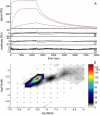
Properties of the surface site distribution in the absence of transport limitation. (A) Binding progress of soluble _β_2-microglobulin to a monoclonal IgG immobilized to a carboxymethylated dextran surface (F1 chip). Analyte concentrations: 0.1, 1, 10, and 100 nM. Experimental curves (solid lines), best-fit curves using the surface site distribution model (bold long dashed lines), and best-fit curves from a single-site model (thin short dashed lines). (B) The single-site model results in a best-fit _K_D = 1.35 nM and _k_off = 1.4 × 10⁻³/s with an RMS error of 1.18 RU. (C) The two-site model converges to _K_D,1 = 1.03 nM and _K_D, 2 = 200 nM with an RMS error 0.56 RU. (D) Residuals of the distribution model with an RMS error of 0.31 RU. (E) Affinity and rate-constant distribution calculated on a grid of _K_D and _k_off value as indicated by the small circles, with the interpolated distribution values indicated by the colored contour plot. Results of the discrete site models are indicated by symbols: single-site (circle), two-site (squares), and three-site (triangles).
FIGURE 2
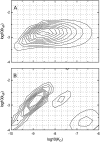
Effect of regularization on the estimated distribution of affinity and kinetic rate constants when using only limited information. (A) Broad distribution obtained from the analysis of only a single kinetic trace at a low analyte concentration. Analysis is based on the trace obtained at 1 nM shown in Fig. 1 A, resulting in an RMS error of 0.25 RU (as compared to 0.35 RU obtained in a single-site fit). (B) A more detailed distribution can be estimated on the basis of the kinetic trace 100 nM shown in Fig. 1 A (fit with an RMS error 0.24 RU; in comparison, a single site results in a fit with an RMS error of 1.17 RU). The best fit can be achieved by the global analysis at all concentrations as shown in Fig. 1 E.
FIGURE 3
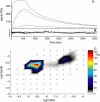
Theoretical model system for a transport-limited distribution. (A) Binding traces were simulated for analyte concentrations of 1, 3, 10, 30, 100, and 200 nM binding to two sites with _K_D,1 = 1 nM and _k_off,1 = 10−3/s, and _K_D,2 = 30 nM and _k_off,2 = 0.015/s, respectively, with a binding capacity of 100 RU each and a transport rate constant of 108 RU/Ms. Gaussian noise of 1 RU was added. (B) Residuals of a fit with an impostor model of a single, transport-limited site, resulting in _log_10(_k_tr) = 7.84 and _K_D = 2.4 nM. (C) Residuals of a fit with an impostor distribution model without transport limitation. (D) Residuals of a fit with the correct model of a transport-limited distribution, which results in an estimate of _log_10(_k_tr) = 7.95, and the distribution shown in panel E. The grid-points for the numerical computation of the distribution are indicated as small circles. The distribution shown was calculated with maximum entropy regularization scaled to a confidence level of approximately p = 0.95.
FIGURE 4
Dependence of the quality of fit on the value of the transport rate constant. The value _k_tr was sequentially fixed to the values indicated, while at each step all other distribution parameters were optimized, including baseline parameters and estimates for the precise injection times. Shown are the resulting best-fit _χ_2 values as a function of _log_10(_k_tr) for the distribution derived from the theoretical model systems in Fig. 3 with (solid line) and without (short dotted line) considering unknown injection times, respectively, and for the distribution shown in Fig. 5 (long dashed line) including the consideration of unknown injection times. Also shown by symbols are the equivalent projections of the error surface from the analysis of the experimental data in Fig. 6 (open circles) and Fig. 7 (solid squares).
FIGURE 5
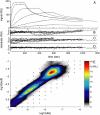
Analysis of a theoretical model system for a transport-limited distribution analogous to Fig. 3, but with higher affinity of the second site as compared to Fig. 3 (_K_D,1 = 1 nM and _k_off,1 = 10−3/s, and _K_D,2 = 5 nM and _k_off,2 = 2.5 × 10⁻³/s, respectively, with a binding capacity of 100 RU each and a transport rate constant of 108 RU/Ms), under otherwise identical conditions. (A) Binding traces were simulated for analyte concentrations of 1, 3, 10, 30, 100, and 200 nM and Gaussian noise of 1 RU was added. (B) Residuals of a fit with an impostor model of a single, transport-limited site, resulting in _log_10(_k_tr) = 8.05, and _K_D = 2.2 nM (RMSD 1.39 RU). (C) Residuals of a fit with an impostor distribution model without transport limitation. (D) Residuals of a fit with the correct model of a transport-limited distribution, which results in an estimate of _log_10(_k_tr) = 7.97, and the distribution shown in panel E. The grid-points for the numerical computation of the distribution are indicated as small circles. The distribution shown was calculated with maximum entropy regularization scaled to a confidence level of approximately p = 0.95.
FIGURE 6
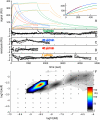
Analysis of the transport-influenced binding of soluble _β_2-microglobulin to a monoclonal IgG immobilized to longer chain carboxymethylated dextran surface (CM5 chip), at a flow rate of 5 _μ_l/min. (A) Experimental data at analyte concentrations of 0.1, 1, 10, and 100 nM (black solid lines). Shown as red dotted lines are the best-fit curves based on a model with a single, transport-influenced site. The residuals of this model are shown on an enhanced scale in panel B. This single-site model results in an RMSD of the fit of 3.57 RU, an estimate of _log_10(_k_tr) of 7.98, and estimates for the binding parameters of _K_D = 3.2 nM and _k_off = 1.2 × 10⁻³/s. (C) Residuals of a model with a distribution of sites, but in the absence of transport limitation (distribution is not shown). The RMSD with this model is 3.31 RU. (D) Residuals from a model for transport-influenced binding to a distribution of sites, with _log_10(_k_tr) = 7.91, leading to an RMSD of 0.52 RU. (E) Calculated distribution with the model for mass transport-influenced binding.
FIGURE 7
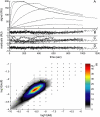
Analysis of the transport-influenced binding to the same surface as shown in Fig. 6, but at a higher flow-rate of 20 _μ_l/min. (A) Experimental data at analyte concentrations of 1, 10, and 100 nM (black solid lines). (B) Residuals from a model for transport-influenced binding to a distribution of sites, with _log_10(_k_tr) = 8.09, leading to an RMSD of 0.52 RU. (C) Calculated distribution.
FIGURE 8
Global fit of the surface binding data acquired at 5, 20, and 40 _μ_l/min with a model for transport-influenced binding to a distribution of surface sites. The transport rate constant and effective injection start times are treated as unknowns local to each data set at the different flow rates (see Fig. 9). The distribution from the 5 _μ_l/min data was taken as starting guess in the distribution to be optimized, and no regularization was used. (A) Experimental data at 1 (orange), 5 (green), 20 (blue), and 40 (red) _μ_l/min for analyte concentrations of 0.1, 1, 10, and 100 nM (no 0.1 nM data available at 20 _μ_l/min). The inset expands the initial association data at an analyte concentration of 10 nM for all flow rates. The results of the global fit are at 5 _μ_l/min: _log_10(_k_tr) = 7.91 with an RMSD of 0.53 RU (B), at 20 _μ_l/min: _log_10(_k_tr) = 8.18 with an RMSD of 0.79 RU (C), at 40 _μ_l/min: _log_10(_k_tr) = 8.21 with an RMSD of 0.66 RU (D). (E) Given the distribution from the fit of the three high flow rates, we applied the distribution as a constant prior knowledge to the data at 1 _μ_l/min, here optimizing solely the transport rate constant, resulting in _log_10(_k_tr) = 7.62 with an RMSD of 0.74 RU. (F) Best-fit distribution, calculated without maximum entropy regularization.
FIGURE 9
Analysis of the dependence of the transport rate constant on the flow rates. Circles depict the estimates of the transport rate constant on the “long dextran” (CM5) surface from the global analysis of Fig. 8, with error bars corresponding to an error in _log_10(_k_tr) of 0.1. The square is the corresponding value obtained for the “short” dextran (F1) surface of Fig. 1. The dotted line is the best-fit from the compartment model for the transport through the stagnant boundary layer according to Eq. 6. It results in an apparent diffusion coefficient of 2.7 × 10⁻⁷cm2/s. Using the known bulk diffusion coefficient of _β_2-microglobulin (16.5 × 10⁻⁷cm2/s, from (53) and viscosity corrected to 25°C), the flow rate dependence of the transport rate constants indicated by the solid black line is expected. If a three-compartment model is used that combines the expected flow-dependent transport through the stagnant boundary with a second, flow-rate independent transport step, a best-fit value of the second transport rate constant of 1.6 × 10⁸ RU/s is obtained. In this case, the total flow-rate dependence of the combined transport is shown by the dashed solid line.
FIGURE 10
Relative decrease of the diffusion coefficient of _β_2-microglobulin dependent on the concentration of carboxymethyl dextran in the sample. Data were determined from FCS measurements. The coefficients were scaled with _D_o, the coefficient of _β_2-microglobulin in the buffer only (no dextran).
FIGURE 11
Binding signal under virtually complete mass transport control. HyHel-10 mAb immobilized to a long-chain carboxymethyl dextran matrix (CM5 chip), and binding of 10 nM (black), 20 nM (green), and 60 nM (blue) soluble antigen (hen egg lysozyme) at a flow rate of 5 _μ_l/min. To highlight the sigmoid-shaped binding curve with increasing slope, a straight (red dotted line) line is plotted for comparison. The inset shows the dissociation trace after incomplete association at 10 nM in enlarged scale. The increasing signal is significant and highly reproducible.
Similar articles
- Combined affinity and rate constant distributions of ligand populations from experimental surface binding kinetics and equilibria.
Svitel J, Balbo A, Mariuzza RA, Gonzales NR, Schuck P. Svitel J, et al. Biophys J. 2003 Jun;84(6):4062-77. doi: 10.1016/S0006-3495(03)75132-7. Biophys J. 2003. PMID: 12770910 Free PMC article. - Designing binding kinetic assay on the bio-layer interferometry (BLI) biosensor to characterize antibody-antigen interactions.
Kamat V, Rafique A. Kamat V, et al. Anal Biochem. 2017 Nov 1;536:16-31. doi: 10.1016/j.ab.2017.08.002. Epub 2017 Aug 10. Anal Biochem. 2017. PMID: 28802648 - Bayesian analysis of heterogeneity in the distribution of binding properties of immobilized surface sites.
Gorshkova II, Svitel J, Razjouyan F, Schuck P. Gorshkova II, et al. Langmuir. 2008 Oct 21;24(20):11577-86. doi: 10.1021/la801186w. Epub 2008 Sep 24. Langmuir. 2008. PMID: 18816013 Free PMC article. - Use of surface plasmon resonance to probe the equilibrium and dynamic aspects of interactions between biological macromolecules.
Schuck P. Schuck P. Annu Rev Biophys Biomol Struct. 1997;26:541-66. doi: 10.1146/annurev.biophys.26.1.541. Annu Rev Biophys Biomol Struct. 1997. PMID: 9241429 Review. - The role of mass transport limitation and surface heterogeneity in the biophysical characterization of macromolecular binding processes by SPR biosensing.
Schuck P, Zhao H. Schuck P, et al. Methods Mol Biol. 2010;627:15-54. doi: 10.1007/978-1-60761-670-2_2. Methods Mol Biol. 2010. PMID: 20217612 Free PMC article. Review.
Cited by
- Biomolecular interactions of ultrasmall metallic nanoparticles and nanoclusters.
Sousa AA, Schuck P, Hassan SA. Sousa AA, et al. Nanoscale Adv. 2021 Apr 28;3(11):2995-3027. doi: 10.1039/d1na00086a. Nanoscale Adv. 2021. PMID: 34124577 Free PMC article. Review. - Binding kinetics of ultrasmall gold nanoparticles with proteins.
Lira AL , Ferreira RS , Torquato RJS , Zhao H , Oliva MLV , Hassan SA , Schuck P , Sousa AA . Lira AL , et al. Nanoscale. 2018 Feb 15;10(7):3235-3244. doi: 10.1039/c7nr06810g. Nanoscale. 2018. PMID: 29383361 Free PMC article. - Humanized monoclonal antibodies derived from chimpanzee Fabs protect against Japanese encephalitis virus in vitro and in vivo.
Goncalvez AP, Chien CH, Tubthong K, Gorshkova I, Roll C, Donau O, Schuck P, Yoksan S, Wang SD, Purcell RH, Lai CJ. Goncalvez AP, et al. J Virol. 2008 Jul;82(14):7009-21. doi: 10.1128/JVI.00291-08. Epub 2008 May 14. J Virol. 2008. PMID: 18480437 Free PMC article. - On the Use of Surface Plasmon Resonance Biosensing to Understand IgG-FcγR Interactions.
Forest-Nault C, Gaudreault J, Henry O, Durocher Y, De Crescenzo G. Forest-Nault C, et al. Int J Mol Sci. 2021 Jun 21;22(12):6616. doi: 10.3390/ijms22126616. Int J Mol Sci. 2021. PMID: 34205578 Free PMC article. Review. - Measuring Protein Interactions by Optical Biosensors.
Zhao H, Boyd LF, Schuck P. Zhao H, et al. Curr Protoc Protein Sci. 2017 Apr 3;88:20.2.1-20.2.25. doi: 10.1002/cpps.31. Curr Protoc Protein Sci. 2017. PMID: 28369667 Free PMC article.
References
- Vijayendran, R. A., and D. E. Leckband. 2001. A quantitative assessment of heterogeneity for surface-immobilized proteins. Anal. Chem. 73:471–480. - PubMed
- Sips, R. 1948. On the structure of a catalyst surface. J. Chem. Phys. 16:490–495.
- Koopal, L. K., and C. H. W. Vos. 1993. Adsorption on heterogeneous surfaces. Calculation of the adsorption energy distribution function or the affinity spectrum. Langmuir. 9:2593–2605.
- Lebedev, K., S. Mafe, and P. Stroeve. 2006. Convection, diffusion and reaction in a surface-based biosensor: modeling of cooperativity and binding site competition on the surface and in the hydrogel. J. Colloid Interface Sci. 296:527–537. - PubMed
- Nisonoff, A., and D. Pressman. 1958. Heterogeneity and average combining constants of antibodies from individual rabbits. J. Immunol. 80:417–428. - PubMed
Publication types
MeSH terms
Substances
LinkOut - more resources
Full Text Sources
Other Literature Sources
