The bacterial actin-like cytoskeleton - PubMed (original) (raw)
Review
The bacterial actin-like cytoskeleton
Rut Carballido-López. Microbiol Mol Biol Rev. 2006 Dec.
Erratum in
- Microbiol Mol Biol Rev. 2007 Mar;71(1):254
Abstract
Recent advances have shown conclusively that bacterial cells possess distant but true homologues of actin (MreB, ParM, and the recently uncovered MamK protein). Despite weak amino acid sequence similarity, MreB and ParM exhibit high structural homology to actin. Just like F-actin in eukaryotes, MreB and ParM assemble into highly dynamic filamentous structures in vivo and in vitro. MreB-like proteins are essential for cell viability and have been implicated in major cellular processes, including cell morphogenesis, chromosome segregation, and cell polarity. ParM (a plasmid-encoded actin homologue) is responsible for driving plasmid-DNA partitioning. The dynamic prokaryotic actin-like cytoskeleton is thought to serve as a central organizer for the targeting and accurate positioning of proteins and nucleoprotein complexes, thereby (and by analogy to the eukaryotic cytoskeleton) spatially and temporally controlling macromolecular trafficking in bacterial cells. In this paper, the general properties and known functions of the actin orthologues in bacteria are reviewed.
Figures
FIG. 1.
Properties of MreB-like proteins. (A to C) Effects of mutations of Bacillus subtilis mreB and mbl on cell shape. Phase-contrast images are shown. Bar, 5 μm. (A) Wild-type cells showing the typical rod shape. (B) Lytic phenotype of cells depleted of MreB. (Panels A and B are reprinted from reference with permission from Blackwell Publishing.) (C) Aberrant morphology of mbl mutant cells. (Reprinted from reference with permission from Elsevier.) (D to F) Helical filaments formed in vivo by the three MreB-like proteins of B. subtilis. (D) GFP-MreB (courtesy of A. Formstone [unpublished]); (E) GFP-Mbl; (F) GFP-MreBH. (G and H) Electron micrographs of negatively stained MreB filaments. (G) MreB forms filamentous bundles and ring-like structures. An enlarged ring structure is shown in panel H. Bars, 0.2 μm and 0.1 μm, respectively. (Reprinted from Journal of Biological Chemistry [47] with permission of the publisher.) (I and J) Comparison of the three-dimensional structures of actin and MreB. (I) Superimposition of uncomplexed actin (purple) and MreB from Thermotoga maritima (blue). (Reprinted, with permission, from the Annual Review of Biophysics and Biomolecular Structure [107] volume 33, copyright 2004 by Annual Reviews.) Despite having very low amino acid sequence identity (∼15%), the two proteins have essentially the same fold. The arrows point to insertions within the actin sequence responsible for binding to DNase I. The arrowhead indicates a loop proposed to make an important interstrand interaction. (J) MreB crystals contain protofilaments that are similar to one strand (protofilament) of modeled F-actin. PDB entry codes are shown in parentheses. (Reprinted from reference with permission from Macmillan Publishers Ltd.)
FIG. 2.
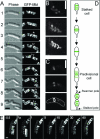
In vivo dynamics of MreB filaments. (A) Time-lapse microscopy of GFP-Mbl dynamics in Bacillus subtilis. A 4-h time course was monitored every 30 min. The crosses indicate fragmentation of the helical structures at about the time of division. Bar, 2 μm. (Reprinted from reference with permission from Elsevier.) (B to D) MreB forms a contracting and expanding spiral in Caulobacter. (B) Helical pattern of GFP-MreB in a stalked cell. The panels show, from top to bottom, a single deconvolved optical section, a volume projection of 15 optical slices, and a cartoon interpretation of the spiral pattern overlaid on the image from the middle. (C) Hollow ring organization of division-plane GFP-MreB localization. The ring is visualized as a continuous band in one optical section (top) and as two separate points in an optical section 300 nm deeper into the cell (middle). The bottom panel shows a cartoon representation of the ring and cell outline overlaid on the image from the panel above. Bars, 1 μm. (D) Schematic representation of the dynamic behavior of GFP-MreB during the Caulobacter cell cycle. (Reprinted from reference with permission of the publisher. Copyright 2004 National Academy of Sciences, U.S.A.) (E) FRAP analysis of GFP-Mbl in live B. subtilis cells. The first panel shows the helical cables of Mbl 0.5 min before photobleaching. The next frame shows the laser photobleaching of a rectangular region covering the lateral half of a cell (_t_0). The following image sequence monitors fluorescence recovery in the bleached Mbl cables at the indicated times (in min). The recovery of fluorescence occurred at the expense of fluorescence in the unbleached cables (indicating an exchange of subunits), with a half-time of ∼8 min. Bar, 1 μm. (Reprinted from reference with permission from Elsevier.)
FIG. 3.
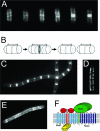
Control of lateral wall synthesis by MreB-like proteins. (A) Van-FL staining of nascent cell wall synthesis in wild-type cells of Bacillus subtilis. A compilation of images of typical cells during the cell cycle progression is shown from left to right. (B) Model for separate systems for septal and cylindrical PG synthesis in B. subtilis. Gray lines and ovals show the sites of PG insertion during elongation and division, respectively. Arrows show the directions of elongation or division driven by cell wall biosynthesis. (C to E) Effects of Δ_mbl_ null mutation (C), Δ_mreB_ null mutation (D), and FtsZ depletion (E) on Van-FL staining. (Panels A, B, C, and E were reprinted from reference with permission from Elsevier. Panel D was reprinted from reference with permission from Blackwell Publishing.) (F) Schematic representation of interactions within the MreBCD complex in E. coli and the possible interaction of MreBCD with periplasmic proteins involved in peptidoglycan synthesis (PBP2 and RodA). (Reprinted from reference with permission from Blackwell Publishing.)
FIG. 4.
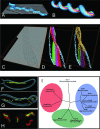
Cytoskeleton structures organized by actin-like proteins in Spiroplasma and Magnetospirillum cells. (A to E) Cryo-electron tomography reveals the cytoskeleton structure of Spiroplasma melliferum. (A) Volume-rendering representation of a whole cell of S. melliferum with a tomogram slice cutting through it longitudinally. (B) 3D simulation of an S. melliferum cell indicating the localization of the three parallel ribbons of the cytoskeleton (red, purple, and green), which are anchored to the cell membrane (blue) and span the length of the cell. (Panels A and B were reprinted from reference with permission from Elsevier.) (C to E) Superimposed slices of a tomogram (z sections are indicated by a bounding box) (C) and two corresponding 3D visualizations (D and E) of part of an S. melliferum cell showing the arrangement of the three ribbons. (C) The cytoskeleton comprises two outer ribbons of thicker filaments and a region of thinner filaments sandwiched between them. (D) Simplified 3D representation of the filament ribbons (green, purple, and red) that wind in parallel helically around the cell just underneath the cell membrane (blue). (E) Idealized visualization of the filaments, with a smooth transition to the original data (yellow). (Reprinted from reference with permission of the publisher. Copyright 2005 American Association for the Advancement of Science.) (F to I) MamK, a homologue of MreB, organizes the magnetosome chain and forms filaments in vivo in Magnetospirillum magneticum sp. strain AMB-1. (F and G) 3D reconstructions of a wild-type AMB-1 cell (F) and a Δ_mamK_ mutant cell (G). The cell membrane (gray), magnetosome membrane (yellow), magnetite (orange), and magnetosome-associated filaments (green) are rendered. (H) MamK fused to GFP (green) forms filaments that localize to the inner curvature of the cell (cell membrane is stained red with FM4-64). (I) Phylogenetic relationship between MamK and other bacterial actins, demonstrated by an unrooted tree. These proteins separate into three distinct groups, i.e., MamK (green), ParM/StbA (red), and MreB (blue). (Reprinted from reference with permission of the publisher. Copyright 2006 American Association for the Advancement of Science.)
FIG. 5.
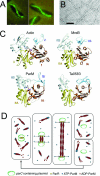
Actin-like filaments formed by plasmid segregation protein ParM. (A) ParM axial filaments in Escherichia coli visualized by combined phase-contrast and immunofluorescence microscopy. (B) Electron micrograph of negatively stained ParM filaments. Polymers have a cross-sectional diameter of ∼7 nm. Bar, 50 nm. (Panels A and B were reprinted from reference with permission from Macmillan Publishers Ltd.) (C) Ribbon representation of the three-dimensional monomer structures of proteins of the actin superfamily, including eukaryotic actin and prokaryotic MreB, ParM, and Ta0583 (MreB-AMPPNP {adenosine 5′-[β-γ-imido]triphosphate}; ADP-bound form for the others) (PDB accession numbers are 1J6Z, 1JCG, 1MWM, and 2FSN, respectively). Subdomains IA, IB, IIA, and IIB correspond to subdomains 1, 2, 3, and 4 in actin. The ADP molecule bound to actin and to ParM is shown in ball-and-stick representation. (Reprinted from reference with permission from Elsevier.) (D) Model for dynamic instability and in vivo function of ParM filaments during the cell cycle. ParM filaments (red) spontaneously assemble/disassemble, displaying dynamic instability in the cell. Upon plasmid (green) replication, plasmid pairs are held together by ParR-bound protein (yellow squares). Both ends of a set of ParM filaments are captured and stabilized by the ParR nucleoprotein complex. As more copies of ParM-ATP (blue) are added at the ParM-ParR interface, the filament/spindle elongates, pulling apart the plasmid copies toward either end of the cell before cell division occurs at midcell. (Reprinted from reference with some modifications, with permission of the publisher. Copyright 2004 American Association for the Advancement of Science.)
FIG. 6.
MreB actin-mediated segregation of the bacterial chromosome. (A) Dysfunctional MreB inhibits chromosome segregation in E. coli. Cells ectopically overexpressed wild-type MreB or an MreB dysfunctional mutant (D165V), as indicated. The top row shows the nucleoid distribution (DNA stained with DAPI [4′,6′-diamidino-2-phenylindole]). The bottom row shows cells expressing a GFP-ParB fusion protein that binds to parS inserted near oriC. Bars, 2 μm. (Reprinted from reference with permission from Macmillan Publishers Ltd.) (B and C) A22 blocks the segregation of origin-proximal, but not origin-distal, loci in Caulobacter crescentus. (B) Schematic of the genetic positions of the origin (green) and the CC2943 locus (red) in the Caulobacter genome. (C) Schematic illustration of the morphology and localization of the origin (green dots) and CC2943 (red dots) in untreated cells (middle row) and when A22 is added to swarmer cells (before segregation of the origins) (top row) and to stalked cells (after segregation of the origins) (bottom row). (Adapted from reference with permission from Elsevier.)
FIG. 7.
MreB-directed polarity in Caulobacter crescentus. (A) MreB affects the localization of the PleC, DivJ, and CckA developmental regulators. Representative images of cells expressing PleC-GFP, DivJ-GFP, and CckA-GFP are shown. Shown are the localization in wild-type cells, in cells with mreB depleted for 24 h, and in cells overexpressing mreB for 6 h. For each cell, images shown were taken with differential interference contrast light microscopy (top image) and GFP fluorescence (bottom image). Bar, 1 μm. (Reprinted from reference with permission of the publisher. Copyright 2004 National Academy of Sciences, U.S.A.) (B) Schematic representing the MreB-dependent localization of molecular markers of cell polarity. In the wild type (top row), the origin of replication (red ovals) and the histidine kinases PleC (blue ovals), DivJ (orange ovals), and CckA (purple ovals) localize to specific poles during the cell cycle. Depletion or overexpression of MreB (middle row) causes the origin to localize to multiple foci and PleC, DivJ, and CckA to delocalize and diffuse throughout the cell. Reinduction of MreB expression (bottom row) repolarizes PleC and DivJ, but the localization of the polar markers is randomized to either pole. (Reprinted, with some modifications, from reference with permission from Elsevier.)
Similar articles
- Molecules of the bacterial cytoskeleton.
Löwe J, van den Ent F, Amos LA. Löwe J, et al. Annu Rev Biophys Biomol Struct. 2004;33:177-98. doi: 10.1146/annurev.biophys.33.110502.132647. Annu Rev Biophys Biomol Struct. 2004. PMID: 15139810 Review. - F-actin-like filaments formed by plasmid segregation protein ParM.
van den Ent F, Møller-Jensen J, Amos LA, Gerdes K, Löwe J. van den Ent F, et al. EMBO J. 2002 Dec 16;21(24):6935-43. doi: 10.1093/emboj/cdf672. EMBO J. 2002. PMID: 12486014 Free PMC article. - Structural/functional homology between the bacterial and eukaryotic cytoskeletons.
Amos LA, van den Ent F, Löwe J. Amos LA, et al. Curr Opin Cell Biol. 2004 Feb;16(1):24-31. doi: 10.1016/j.ceb.2003.11.005. Curr Opin Cell Biol. 2004. PMID: 15037301 Review. - Prokaryotic origin of the actin cytoskeleton.
van den Ent F, Amos LA, Löwe J. van den Ent F, et al. Nature. 2001 Sep 6;413(6851):39-44. doi: 10.1038/35092500. Nature. 2001. PMID: 11544518 - Increasing complexity of the bacterial cytoskeleton.
Møller-Jensen J, Löwe J. Møller-Jensen J, et al. Curr Opin Cell Biol. 2005 Feb;17(1):75-81. doi: 10.1016/j.ceb.2004.11.002. Curr Opin Cell Biol. 2005. PMID: 15661522 Review.
Cited by
- Phosphorylation of a novel cytoskeletal protein (RsmP) regulates rod-shaped morphology in Corynebacterium glutamicum.
Fiuza M, Letek M, Leiba J, Villadangos AF, Vaquera J, Zanella-Cléon I, Mateos LM, Molle V, Gil JA. Fiuza M, et al. J Biol Chem. 2010 Sep 17;285(38):29387-97. doi: 10.1074/jbc.M110.154427. Epub 2010 Jul 9. J Biol Chem. 2010. PMID: 20622015 Free PMC article. - A novel actin-related protein is associated with daughter cell formation in Toxoplasma gondii.
Gordon JL, Beatty WL, Sibley LD. Gordon JL, et al. Eukaryot Cell. 2008 Sep;7(9):1500-12. doi: 10.1128/EC.00064-08. Epub 2008 Apr 11. Eukaryot Cell. 2008. PMID: 18408052 Free PMC article. - Assemblies of DivIVA mark sites for hyphal branching and can establish new zones of cell wall growth in Streptomyces coelicolor.
Hempel AM, Wang SB, Letek M, Gil JA, Flärdh K. Hempel AM, et al. J Bacteriol. 2008 Nov;190(22):7579-83. doi: 10.1128/JB.00839-08. Epub 2008 Sep 19. J Bacteriol. 2008. PMID: 18805980 Free PMC article. - Functional analysis of the cytoskeleton protein MreB from Chlamydophila pneumoniae.
Gaballah A, Kloeckner A, Otten C, Sahl HG, Henrichfreise B. Gaballah A, et al. PLoS One. 2011;6(10):e25129. doi: 10.1371/journal.pone.0025129. Epub 2011 Oct 5. PLoS One. 2011. PMID: 22022378 Free PMC article. - The ParMRC system: molecular mechanisms of plasmid segregation by actin-like filaments.
Salje J, Gayathri P, Löwe J. Salje J, et al. Nat Rev Microbiol. 2010 Oct;8(10):683-92. doi: 10.1038/nrmicro2425. Nat Rev Microbiol. 2010. PMID: 20844556 Review.
References
- Alaedini, A., and R. A. Day. 1999. Identification of two penicillin-binding multienzyme complexes in Haemophilus influenzae. Biochem. Biophys. Res. Commun. 264:191-195. - PubMed
- Ausmees, N., J. R. Kuhn, and C. Jacobs-Wagner. 2003. The bacterial cytoskeleton: an intermediate filament-like function in cell shape. Cell 115:705-713. - PubMed
- Beall, B., and J. Lutkenhaus. 1991. FtsZ in Bacillus subtilis is required for vegetative septation and for asymmetric septation during sporulation. Genes Dev. 5:447-455. - PubMed
- Ben-Yehuda, S., and R. Losick. 2002. Asymmetric cell division in B. subtilis involves a spiral-like intermediate of the cytokinetic protein FtsZ. Cell 109:257-266. - PubMed
Publication types
MeSH terms
Substances
LinkOut - more resources
Full Text Sources


