A comprehensive analysis of common copy-number variations in the human genome - PubMed (original) (raw)
A comprehensive analysis of common copy-number variations in the human genome
Kendy K Wong et al. Am J Hum Genet. 2007 Jan.
Abstract
Segmental copy-number variations (CNVs) in the human genome are associated with developmental disorders and susceptibility to diseases. More importantly, CNVs may represent a major genetic component of our phenotypic diversity. In this study, using a whole-genome array comparative genomic hybridization assay, we identified 3,654 autosomal segmental CNVs, 800 of which appeared at a frequency of at least 3%. Of these frequent CNVs, 77% are novel. In the 95 individuals analyzed, the two most diverse genomes differed by at least 9 Mb in size or varied by at least 266 loci in content. Approximately 68% of the 800 polymorphic regions overlap with genes, which may reflect human diversity in senses (smell, hearing, taste, and sight), rhesus phenotype, metabolism, and disease susceptibility. Intriguingly, 14 polymorphic regions harbor 21 of the known human microRNAs, raising the possibility of the contribution of microRNAs to phenotypic diversity in humans. This in-depth survey of CNVs across the human genome provides a valuable baseline for studies involving human genetics.
Figures
Figure A1.
Flowchart for calculations. A, Determination of false-positive and false-negative rates in this study by use of six repeat experiments of single female DNA vs male reference DNA, analyzed using our CNV algorithm. B, Calculation for CNV overlaps in replicate experiments.
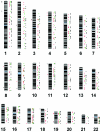
Figure 1.
Example of a karyogram from a hybridization experiment in this study. Custom SeeGH software was used to visualize normalized data as log2 ratio plots. The figure illustrates an example of a hybridization of a female sample versus the male reference. The log2 ratios of the data are shown as dots; the left and right vertical lines represent threshold lines for this experiment at log2 ratios of −0.18 and 0.18, respectively.
Figure 2.
Detection of CNVs. The upper part illustrates a region of CNV at 19p13.2 among four individuals. Each short line represents the average fluorescent intensity ratio between sample and reference DNA for an individual BAC clone spotted on the array. The left and right vertical lines represent the average threshold for the hybridizations shown, at log2 ratios of −0.25 and 0.25. A ratio to the right of the positive threshold line represents a copy-number gain, whereas a ratio to the left of the negative threshold represents a copy-number loss. Equal, greater, and fewer copies relative to the reference DNA are shown. The lower part illustrates a single BAC clone CNV at 7q32.1 among the four individuals; the clone (RP11-636E12) overlaps with the IMPDH1 gene, a mutation in which was shown to cause retinitis pigmentosa.
Figure 3.
Distribution of overlapped CNVs at different recurrence levels. The percentage of our CNV loci that overlapped with previously reported CNVs were plotted against minimum recurrence levels of CNVs from 1 to 50 within our sample set of 95.
Figure 4.
Overlap of CNVs with segmental duplications (SD). The percentage of BACs that contain segmental duplications (>10 kb) is graphed against the frequency of the CNV (0 = no variation) for two measures of human segmental duplication (WSSD and WGAC; see the “Material and Methods” section). Segmental duplications unique to human or chimpanzee are further distinguished.
Figure 5.
Cluster analysis by use of a CEPH pedigree. Clustering of 105 individuals was based on the high-frequency CNV clones. The 14 CEPH pedigree members are indicated by triangles.
Figure 6.
Distribution of CNV clones. High-frequency CNV clones are shown as dots to the right of each chromosome; red, green, and black dots represent presence in three, four or five, and six or more individuals, respectively. Dots to the left of the chromosomes represent locations of CNVs that overlap microRNAs (red dots) and select cancer genes (black dots).
Figure 7.
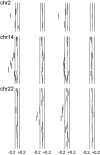
Detection of immunoglobulin variations. The three parts illustrate expected CNVs associated with the immunoglobulin loci at 2p11.2, 14q32.33, and 22q11.22 (top, middle, and bottom, respectively). The left and right vertical lines represent the average threshold for the hybridizations shown, at log2 ratios of −0.2 and 0.2. An equal intensity ratio falls on the middle line (log2 ratio of 0), a ratio to the right of the positive threshold line represents a copy-number gain, and a ratio to the left of the negative threshold represents a copy-number loss. chr = Chromosome.
Figure 8.
Inheritance of CNVs at five olfactory receptor loci in 14 members of a CEPH pedigree. The five loci (and clones), in the order shown, are OR2A1 (RP11-466J6), OR2Z1 (RP11-367L15 and RP11-282G19), OR4K1 (RP11-449I24 and CTD-2024K23), OR4M1 (RP11-597A11), and OR4Q3 (RP11-490A23). − = Copy-number loss; + = copy-number gain; 0 = no copy-number change; UI = uninformative. Male and female family members are shown as squares and circles, respectively.
Comment in
- Copy-number variations and human disease.
Hegele RA. Hegele RA. Am J Hum Genet. 2007 Aug;81(2):414-5; author reply 415. doi: 10.1086/519220. Am J Hum Genet. 2007. PMID: 17668391 Free PMC article. No abstract available. - Numbers of copy-number variations and false-negative rates will be underestimated if we do not account for the dependence between repeated experiments.
Lynch AG, Marioni JC, Tavaré S. Lynch AG, et al. Am J Hum Genet. 2007 Aug;81(2):418-20; author reply 420-1. doi: 10.1086/519393. Am J Hum Genet. 2007. PMID: 17668395 Free PMC article. No abstract available. - Estimating prevalence, false-positive rate, and false-negative rate with use of repeated testing when true responses are unknown.
Jakobsdottir J, Weeks DE. Jakobsdottir J, et al. Am J Hum Genet. 2007 Nov;81(5):1111-3. doi: 10.1086/521582. Am J Hum Genet. 2007. PMID: 17924351 Free PMC article. No abstract available.
Similar articles
- Systematic inference of copy-number genotypes from personal genome sequencing data reveals extensive olfactory receptor gene content diversity.
Waszak SM, Hasin Y, Zichner T, Olender T, Keydar I, Khen M, Stütz AM, Schlattl A, Lancet D, Korbel JO. Waszak SM, et al. PLoS Comput Biol. 2010 Nov 11;6(11):e1000988. doi: 10.1371/journal.pcbi.1000988. PLoS Comput Biol. 2010. PMID: 21085617 Free PMC article. - High-resolution copy-number variation map reflects human olfactory receptor diversity and evolution.
Hasin Y, Olender T, Khen M, Gonzaga-Jauregui C, Kim PM, Urban AE, Snyder M, Gerstein MB, Lancet D, Korbel JO. Hasin Y, et al. PLoS Genet. 2008 Nov;4(11):e1000249. doi: 10.1371/journal.pgen.1000249. Epub 2008 Nov 7. PLoS Genet. 2008. PMID: 18989455 Free PMC article. - A high-resolution map of segmental DNA copy number variation in the mouse genome.
Graubert TA, Cahan P, Edwin D, Selzer RR, Richmond TA, Eis PS, Shannon WD, Li X, McLeod HL, Cheverud JM, Ley TJ. Graubert TA, et al. PLoS Genet. 2007 Jan 5;3(1):e3. doi: 10.1371/journal.pgen.0030003. Epub 2006 Nov 22. PLoS Genet. 2007. PMID: 17206864 Free PMC article. - Copy number variation: new insights in genome diversity.
Freeman JL, Perry GH, Feuk L, Redon R, McCarroll SA, Altshuler DM, Aburatani H, Jones KW, Tyler-Smith C, Hurles ME, Carter NP, Scherer SW, Lee C. Freeman JL, et al. Genome Res. 2006 Aug;16(8):949-61. doi: 10.1101/gr.3677206. Epub 2006 Jun 29. Genome Res. 2006. PMID: 16809666 Review. - Human olfaction: from genomic variation to phenotypic diversity.
Hasin-Brumshtein Y, Lancet D, Olender T. Hasin-Brumshtein Y, et al. Trends Genet. 2009 Apr;25(4):178-84. doi: 10.1016/j.tig.2009.02.002. Epub 2009 Mar 18. Trends Genet. 2009. PMID: 19303166 Review.
Cited by
- Massive screening of copy number population-scale variation in Bos taurus genome.
Cicconardi F, Chillemi G, Tramontano A, Marchitelli C, Valentini A, Ajmone-Marsan P, Nardone A. Cicconardi F, et al. BMC Genomics. 2013 Feb 26;14:124. doi: 10.1186/1471-2164-14-124. BMC Genomics. 2013. PMID: 23442185 Free PMC article. - Divergence patterns of genic copy number variation in natural populations of the house mouse (Mus musculus domesticus) reveal three conserved genes with major population-specific expansions.
Pezer Ž, Harr B, Teschke M, Babiker H, Tautz D. Pezer Ž, et al. Genome Res. 2015 Aug;25(8):1114-24. doi: 10.1101/gr.187187.114. Epub 2015 Jul 6. Genome Res. 2015. PMID: 26149421 Free PMC article. - Association Analysis of ULK1 with Crohn's Disease in a New Zealand Population.
Morgan AR, Lam WJ, Han DY, Fraser AG, Ferguson LR. Morgan AR, et al. Gastroenterol Res Pract. 2012;2012:715309. doi: 10.1155/2012/715309. Epub 2012 Mar 20. Gastroenterol Res Pract. 2012. PMID: 22536218 Free PMC article. - Ohno's dilemma: evolution of new genes under continuous selection.
Bergthorsson U, Andersson DI, Roth JR. Bergthorsson U, et al. Proc Natl Acad Sci U S A. 2007 Oct 23;104(43):17004-9. doi: 10.1073/pnas.0707158104. Epub 2007 Oct 17. Proc Natl Acad Sci U S A. 2007. PMID: 17942681 Free PMC article. - Numbers of copy-number variations and false-negative rates will be underestimated if we do not account for the dependence between repeated experiments.
Lynch AG, Marioni JC, Tavaré S. Lynch AG, et al. Am J Hum Genet. 2007 Aug;81(2):418-20; author reply 420-1. doi: 10.1086/519393. Am J Hum Genet. 2007. PMID: 17668395 Free PMC article. No abstract available.
References
Web Resources
- BACPAC Resources, http://bacpac.chori.org/genomicRearrays.php (for UCSC May 2004 mapping annotations)
- Database of Genomic Variants, http://projects.tcag.ca/variation/
- Eisen Lab: Software, http://rana.lbl.gov/EisenSoftware.htm (for Cluster and Treeview)
- Gene Expression Omnibus (GEO), http://www.ncbi.nlm.nih.gov/geo/
References
Publication types
MeSH terms
Substances
LinkOut - more resources
Full Text Sources
Other Literature Sources
Molecular Biology Databases
Research Materials
Miscellaneous


