Selection of target sites for mobile DNA integration in the human genome - PubMed (original) (raw)
Selection of target sites for mobile DNA integration in the human genome
Charles Berry et al. PLoS Comput Biol. 2006.
Abstract
DNA sequences from retroviruses, retrotransposons, DNA transposons, and parvoviruses can all become integrated into the human genome. Accumulation of such sequences accounts for at least 40% of our genome today. These integrating elements are also of interest as gene-delivery vectors for human gene therapy. Here we present a comprehensive bioinformatic analysis of integration targeting by HIV, MLV, ASLV, SFV, L1, SB, and AAV. We used a mathematical method which allowed annotation of each base pair in the human genome for its likelihood of hosting an integration event by each type of element, taking advantage of more than 200 types of genomic annotation. This bioinformatic resource documents a wealth of new associations between genomic features and integration targeting. The study also revealed that the length of genomic intervals analyzed strongly affected the conclusions drawn--thus, answering the question "What genomic features affect integration?" requires carefully specifying the length scale of interest.
Conflict of interest statement
Competing interests. The authors have declared that no competing interests exist.
Figures
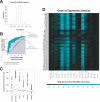
Figure 1. ROC Curves as a Measure of the Association of DNA Integration with Genomic Features
(A) Diagram of the ROC analysis. The graph plots the true positive rate against the false positive rate for every possible cutpoint; vertical steps result when only the true positive rate increases as the cutpoint (i.e., cutoff value for the genomic feature) moves down; horizontal steps result when only the false positive rate increases, and when both rates increase as the cutpoint moves down the graph “steps” diagonally. The example shows the effects of score.20 on SB integration (though the method of construction is general). The area between the curve and the “no discrimination” line indicates discrimination between integration sites and random controls by the predictor tested. The curve will lie beneath the line of “no discrimination”—leading to an area of less than 0—if integration sites tend to have lower values of the variable under study than random controls. For details see the text and Text S1. (B) Box plots summarizing ROC results. Each box in Figure 1B indicates the first and third quartiles of the values, while the heavy line in the middle gives the median value. The “whiskers” extend to the most extreme observation within 1.5× the interquartile range of the median. Points that lie beyond the whiskers are plotted individually. For each box plot, the number of points is 17 (the number of datasets) times the number of rows in the relevant heat map for that feature (in Text S2; selected examples of heat maps are shown in Figures 2–4). Specifically, the numbers of points were 170 for gene.exon, 1173 for gene.density, 153 for dnase, 306 for cpg, 340 for juxtapos, 1870 for transfac, 17 for score.20.all, and 340 for score.20.1.bp.
Figure 2. ROC Areas Describing the Effects of DNA Sequences at the 20 bp Surrounding the Point of Integration (Named “score.20”)
(A) Heat map of ROC areas describing the influence of sequences at the point of integration. The key at the bottom indicates the color code for ROC values in this and subsequent figures. The top row indicates the summed effect over all the bases in the score.20 motif, and the individual bars below show the area for each individual base in the motif. The site of integration in each case was between base −1 and 1. (B) PWMs for sequences at the point of integration. Bases shown above the line were favorable for integration; those below were unfavorable. The integrating elements differ in the symmetry of the score.20 PWM at the site of integration. The points of joining on the top and bottom DNA strands have been determined experimentally for some cases, and where available are shown by the arrows in Figure 2B. For most of the elements, the sequences are approximately 2-fold rotationally symmetric through an axis between the points of joining on the two strands—this is because, in these cases at the two ends of the element DNA, the DNA breaking and joining steps mediating integration are identical. The exceptions are L1 and AAV, for which the points in the target DNA for joining of the two ends of the element do not have a consistent relationship. Note that the values given for Mij are the logarithms of the relative frequency of nucleotide i at position j among the integration sites compared with its value among the random controls. Thus, if nucleotide i almost always appears in position j in integration sites, Mij will approximate log(2) − log(1/4) ≈ 1.4, while if it appears only once in 128 integration sites Mij will approximate log(1/128) − log(1/4) ≈ −3.5. (C) ROC values for score.20 considered over longer genomic intervals. The number after score.20 on the vertical axis indicates the length in bp, then in kb (the later indicated by k).
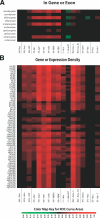
Figure 3. ROC Areas Describing the Effects of Gene-Associated Features on Integration Frequency
(A) ROC areas describing the effects of integration within a gene or exon. The databases studied were as indicated. The geneScan database is solely computational, possibly explaining the divergence of ROC areas from the other gene calls. (B) ROC areas describing the effects of gene density or expression density on integration frequency. To calculate the expression density, each gene in an interval was assigned three scores of zero or one according to whether it was 1) in the upper half, 2) in the upper quarter, or 3) in the upper 12.5% of all genes scored in a transcriptional profiling analysis. Transcriptional profiling was carried out using Affymetrix arrays for each of the cell types studied (accession numbers for array data are in Table S1). For each of the three cutoffs, the expression scores for all the genes in each genomic interval were then added together and divided by the interval width to generate the expression-density measure counting the number of expressed genes for that interval.
Figure 4. ROC Areas Describing the Effects of Genomic Features on Integration Frequency
(A) ROC areas describing the effects of G/C content and CpG islands on integration frequency. CpG islands are on average 764 bp in length. (B) ROC areas describing the relationship between DNase I site density and integration frequency over intervals of different sizes. Each DNase I cleavage site is measured as a single point of cleavage on the human genome. (C) ROC areas describing the effects of proximity to gene boundaries on integration.
Figure 5. Improved Prediction due to Adding Additional Genomic Features to the score.20 ROC Values
(A) Lack of correlation between score.20 and other measures. (B) Diagram of the analytical method, illustrating the improvement of an ROC score by addition of a second predictor to the score.20 value. (C) Box plots describing the improvements in ROC area resulting from combining other genomic features with the score.20 measure. The ROC area increments are modest, because the ROC curve based on the combination of score.20 and another feature can only vary between the value for the score.20 prediction and 1.0. (D) Heat map of increases in ROC areas resulting from adding the gene density measures to the score.20 values for each integrating element. The color code for improvements in ROC areas is indicated at the bottom.
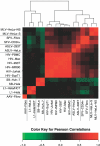
Figure 6. Clustering the Comprehensive BMA Integration Site Models
Red indicates positive correlation and green indicates negative, as illustrated by the key at the bottom of the figure. The models were clustered in both the _x_- and _y_- directions, so the graph is symmetrical along a line from lower left to upper right. See Text S2 for more details.
Similar articles
- Retroviral DNA integration: ASLV, HIV, and MLV show distinct target site preferences.
Mitchell RS, Beitzel BF, Schroder AR, Shinn P, Chen H, Berry CC, Ecker JR, Bushman FD. Mitchell RS, et al. PLoS Biol. 2004 Aug;2(8):E234. doi: 10.1371/journal.pbio.0020234. Epub 2004 Aug 17. PLoS Biol. 2004. PMID: 15314653 Free PMC article. - Human T-cell leukemia virus type 1 integration target sites in the human genome: comparison with those of other retroviruses.
Derse D, Crise B, Li Y, Princler G, Lum N, Stewart C, McGrath CF, Hughes SH, Munroe DJ, Wu X. Derse D, et al. J Virol. 2007 Jun;81(12):6731-41. doi: 10.1128/JVI.02752-06. Epub 2007 Apr 4. J Virol. 2007. PMID: 17409138 Free PMC article. - VISDB: a manually curated database of viral integration sites in the human genome.
Tang D, Li B, Xu T, Hu R, Tan D, Song X, Jia P, Zhao Z. Tang D, et al. Nucleic Acids Res. 2020 Jan 8;48(D1):D633-D641. doi: 10.1093/nar/gkz867. Nucleic Acids Res. 2020. PMID: 31598702 Free PMC article. - Integration target site selection for retroviruses and transposable elements.
Wu X, Burgess SM. Wu X, et al. Cell Mol Life Sci. 2004 Oct;61(19-20):2588-96. doi: 10.1007/s00018-004-4206-9. Cell Mol Life Sci. 2004. PMID: 15526164 Review. - Targeting survival: integration site selection by retroviruses and LTR-retrotransposons.
Bushman FD. Bushman FD. Cell. 2003 Oct 17;115(2):135-8. doi: 10.1016/s0092-8674(03)00760-8. Cell. 2003. PMID: 14567911 Review.
Cited by
- Use of HSC-targeted LNP to generate a mouse model of lethal α-thalassemia and treatment via lentiviral gene therapy.
Chappell ME, Breda L, Tricoli L, Guerra A, Jarocha D, Castruccio Castracani C, Papp TE, Tanaka N, Hamilton N, Triebwasser MP, Ghiaccio V, Fedorky MT, Gollomp KL, Bochenek V, Roche AM, Everett JK, Cook EJ, Bushman FD, Teawtrakul N, Glentis S, Kattamis A, Mui BL, Tam YK, Weissman D, Abdulmalik O, Parhiz H, Rivella S. Chappell ME, et al. Blood. 2024 Oct 10;144(15):1633-1645. doi: 10.1182/blood.2023023349. Blood. 2024. PMID: 38949981 - Biodistribution of lentiviral transduced adipose-derived stem cells for "ex-vivo" regional gene therapy for bone repair.
Bell JA, Collon K, Mayfield C, Gallo MC, Chang SW, Sugiyama O, Tang AH, Hollis R, Chopra S, Kohn DB, Lieberman JR. Bell JA, et al. Gene Ther. 2023 Dec;30(12):826-834. doi: 10.1038/s41434-023-00415-z. Epub 2023 Aug 11. Gene Ther. 2023. PMID: 37568039 - The HIV-1 Capsid-Targeted Inhibitor GSK878 Alters Selection of Target Sites for HIV DNA Integration.
Marquis KA, Everett J, Cantu A, McFarland A, Sherrill-Mix S, Krystal M, Parcella K, Gillis E, Fridell RA, Bushman FD. Marquis KA, et al. AIDS Res Hum Retroviruses. 2024 Feb;40(2):114-126. doi: 10.1089/AID.2022.0161. Epub 2023 Jun 7. AIDS Res Hum Retroviruses. 2024. PMID: 37125442 - Transmicron: accurate prediction of insertion probabilities improves detection of cancer driver genes from transposon mutagenesis screens.
Bredthauer C, Fischer A, Ahari AJ, Cao X, Weber J, Rad L, Rad R, Wachutka L, Gagneur J. Bredthauer C, et al. Nucleic Acids Res. 2023 Feb 28;51(4):e21. doi: 10.1093/nar/gkac1215. Nucleic Acids Res. 2023. PMID: 36617985 Free PMC article. - G-Quadruplex DNA and Other Non-Canonical B-Form DNA Motifs Influence Productive and Latent HIV-1 Integration and Reactivation Potential.
Ajoge HO, Kohio HP, Paparisto E, Coleman MD, Wong K, Tom SK, Bain KL, Berry CC, Arts EJ, Barr SD. Ajoge HO, et al. Viruses. 2022 Nov 11;14(11):2494. doi: 10.3390/v14112494. Viruses. 2022. PMID: 36423103 Free PMC article.
References
- Lander ES, Linton LM, Birren B, Nusbaum C, et al. Initial sequencing and analysis of the human genome. Nature. 2001;409:860–921. - PubMed
- Venter JC, Adams MD, Myers EW, Li PW, Mural RJ, et al. The sequence of the human genome. Science. 2001;291:1304–1351. - PubMed
- Craig NL, Craigie R, Gellert M, Lambowitz AM, editors. Mobile DNA II. Washington (D.C.): ASM Press; 2002. 1204
- Bushman FD. Lateral DNA transfer: Mechanisms and consequences. New York: Cold Spring Harbor Laboratory Press; 2001. 448
- Hacein-Bey-Abina S, von Kalle C, Schmidt M, Le Deist F, Wulffraat N, et al. A serious adverse event after successful gene therapy for X-linked severe combined immunodeficiency. N Engl J Med. 2003;348:255–256. - PubMed
Publication types
MeSH terms
Substances
LinkOut - more resources
Full Text Sources
Other Literature Sources


