MathDAMP: a package for differential analysis of metabolite profiles - PubMed (original) (raw)
MathDAMP: a package for differential analysis of metabolite profiles
Richard Baran et al. BMC Bioinformatics. 2006.
Abstract
Background: With the advent of metabolomics as a powerful tool for both functional and biomarker discovery, the identification of specific differences between complex metabolite profiles is becoming a major challenge in the data analysis pipeline. The task remains difficult, given the datasets' size, complexity, and common shifts in migration (elution/retention) times between samples analyzed by hyphenated mass spectrometry methods.
Results: We present a Mathematica (Wolfram Research, Inc.) package MathDAMP (Mathematica package for Differential Analysis of Metabolite Profiles), which highlights differences between raw datasets acquired by hyphenated mass spectrometry methods by applying arithmetic operations to all corresponding signal intensities on a datapoint-by-datapoint basis. Peak identification and integration is thus bypassed and the results are displayed graphically. To facilitate direct comparisons, the raw datasets are automatically preprocessed and normalized in terms of both migration times and signal intensities. A combination of dynamic programming and global optimization is used for the alignment of the datasets along the migration time dimension. The processed datasets and the results of direct comparisons between them are visualized using density plots (axes represent migration time and m/z values while peaks appear as color-coded spots) providing an intuitive overall view. Various forms of comparisons and statistical tests can be applied to highlight subtle differences. Overlaid electropherograms (chromatograms) corresponding to the vicinities of the candidate differences from any result may be generated in a descending order of significance for visual confirmation. Additionally, a standard library table (a list of m/z values and migration times for known compounds) may be aligned and overlaid on the plots to allow easier identification of metabolites.
Conclusion: Our tool facilitates the visualization and identification of differences between complex metabolite profiles according to various criteria in an automated fashion and is useful for data-driven discovery of biomarkers and functional genomics.
Figures
Figure 1
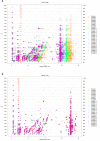
Peak picking and migration time alignment. (a) Visualization of the position of peaks picked from cation datasets acquired by CE-TOFMS. The data originates from a previous analysis of mouse liver extracts after treatment with acetaminophen [13]. (b) The peak sets were aligned to the peak set from Sample 1 using the alignment procedure described in the main text. The function derived by Reijenga et al. [14] for the normalization of migration times in CE was used as the time shift function.
Figure 2
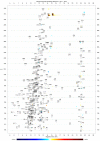
Comparison of two groups of replicate datasets. Visualization of an absolute × relative difference result between the averages of two groups of replicate cation datasets (n = 4). The result was further filtered as described in the main text with a _t_-score threshold of 3.71 (corresponding p = 0.01 when comparing two groups of four replicate values). The initial _t_-score dataset was smoothed by applying a moving average filter (window size 9) prior to filtering the absolute × relative result. Red color indicates signals with higher levels in Set 2, blue color indicates signals with lower levels in Set 2. The underlying datasets originate from previous work [13].
Figure 3
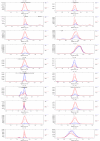
Visualization of candidate differences as extracted ion electropherograms. Overlaid electropherograms from aligned and normalized datasets corresponding to the vicinities of the 20 most significant differences in the dataset shown in Figure 2. The underlying datasets originate from previous work [13].
Similar articles
- Time alignment algorithms based on selected mass traces for complex LC-MS data.
Christin C, Hoefsloot HC, Smilde AK, Suits F, Bischoff R, Horvatovich PL. Christin C, et al. J Proteome Res. 2010 Mar 5;9(3):1483-95. doi: 10.1021/pr9010124. J Proteome Res. 2010. PMID: 20070124 - Statistical Viewer: a tool to upload and integrate linkage and association data as plots displayed within the Ensembl genome browser.
Stenger JE, Xu H, Haynes C, Hauser ER, Pericak-Vance M, Goldschmidt-Clermont PJ, Vance JM. Stenger JE, et al. BMC Bioinformatics. 2005 Apr 12;6:95. doi: 10.1186/1471-2105-6-95. BMC Bioinformatics. 2005. PMID: 15826305 Free PMC article. - MetMatch: A Semi-Automated Software Tool for the Comparison and Alignment of LC-HRMS Data from Different Metabolomics Experiments.
Koch S, Bueschl C, Doppler M, Simader A, Meng-Reiterer J, Lemmens M, Schuhmacher R. Koch S, et al. Metabolites. 2016 Nov 2;6(4):39. doi: 10.3390/metabo6040039. Metabolites. 2016. PMID: 27827849 Free PMC article. - Integration of metabolomics and proteomics in molecular plant physiology--coping with the complexity by data-dimensionality reduction.
Weckwerth W. Weckwerth W. Physiol Plant. 2008 Feb;132(2):176-89. doi: 10.1111/j.1399-3054.2007.01011.x. Physiol Plant. 2008. PMID: 18251859 Review. - Functional genomics and proteomics in the clinical neurosciences: data mining and bioinformatics.
Phan JH, Quo CF, Wang MD. Phan JH, et al. Prog Brain Res. 2006;158:83-108. doi: 10.1016/S0079-6123(06)58004-5. Prog Brain Res. 2006. PMID: 17027692 Review.
Cited by
- Recent advances in proteomics and metabolomics in plants.
Yan S, Bhawal R, Yin Z, Thannhauser TW, Zhang S. Yan S, et al. Mol Hortic. 2022 Jul 23;2(1):17. doi: 10.1186/s43897-022-00038-9. Mol Hortic. 2022. PMID: 37789425 Free PMC article. Review. - Metabonomics-based omics study and atherosclerosis.
Wu DJ, Zhu BJ, Wang XD. Wu DJ, et al. J Clin Bioinforma. 2011 Oct 31;1:30. doi: 10.1186/2043-9113-1-30. J Clin Bioinforma. 2011. PMID: 22040517 Free PMC article. - Intriguing Interaction of Bacteriophage-Host Association: An Understanding in the Era of Omics.
Parmar KM, Gaikwad SL, Dhakephalkar PK, Kothari R, Singh RP. Parmar KM, et al. Front Microbiol. 2017 Apr 7;8:559. doi: 10.3389/fmicb.2017.00559. eCollection 2017. Front Microbiol. 2017. PMID: 28439260 Free PMC article. Review. - MathIOmica-MSViewer: a dynamic viewer for mass spectrometry files for Mathematica.
Roushangar R, Mias GI. Roushangar R, et al. J Mass Spectrom. 2017 May;52(5):315-318. doi: 10.1002/jms.3928. J Mass Spectrom. 2017. PMID: 28299837 Free PMC article. - Kernel approaches for differential expression analysis of mass spectrometry-based metabolomics data.
Zhan X, Patterson AD, Ghosh D. Zhan X, et al. BMC Bioinformatics. 2015 Mar 11;16:77. doi: 10.1186/s12859-015-0506-3. BMC Bioinformatics. 2015. PMID: 25887233 Free PMC article.
References
Publication types
MeSH terms
Substances
LinkOut - more resources
Full Text Sources
Other Literature Sources


