Identification of long-range regulatory elements in the protocadherin-alpha gene cluster - PubMed (original) (raw)
Identification of long-range regulatory elements in the protocadherin-alpha gene cluster
Scott Ribich et al. Proc Natl Acad Sci U S A. 2006.
Abstract
The clustered protocadherins (Pcdh) are encoded by three closely linked gene clusters (Pcdh-alpha, -beta, and -gamma) that span nearly 1 million base pairs of DNA. The Pcdh-alpha gene cluster encodes a family of 14 distinct cadherin-like cell surface proteins that are expressed in neurons and are present at synaptic junctions. Individual Pcdh-alpha mRNAs are assembled from one of 14 "variable" (V) exons and three "constant" exons in a process that involves both differential promoter activation and alternative pre-mRNA splicing. In individual neurons, only one (and rarely two) of the Pcdh alpha1-12 promoters is independently and randomly activated on each chromosome. Thus, in most cells, this unusual form of monoallelic expression leads to the expression of two different Pcdh-alpha 1-12 V exons, one from each chromosome. The two remaining V exons in the cluster (Pcdh-alphaC1 and alphaC2) are expressed biallelically in every neuron. The mechanisms that underlie promoter choice and monoallelic expression in the Pcdh-alpha gene cluster are not understood. Here we report the identification of two long-range cis-regulatory elements in the Pcdh-alpha gene cluster, HS5-1 and HS7. We show that HS5-1 is required for maximal levels of expression from the Pcdh alpha1-12 and alphaC1 promoters, but not the Pcdh-alphaC2 promoter. The nearly cluster-wide requirement of the HS5-1 element is consistent with the possibility that the monoallelic expression of Pcdh-alpha V exons is a consequence of competition between individual V exon promoters for the two regulatory elements.
Conflict of interest statement
The authors declare no conflict of interest.
Figures
Fig. 1.
CISs in the mouse and human _Pcdh_-α gene clusters. (A) Genomic organization of the mouse _Pcdh_-α gene cluster. The _Pcdh_-α gene cluster spans ≈350 kb of mouse chromosome 18. Individual V exons (denoted by V, light-green ovals) are individually spliced to the three constant-region exons (denoted by Con, dark-green ovals). Gray ovals indicate relics of a _Pcdh_-α V exon. (B) Sequence comparison between mouse and human for portions of the _Pcdh_-α cluster using VISTA. The y axis indicates percent mouse/human sequence identity. The x axis indicates position along the cluster as measured in kilobase pairs. Blue shading denotes exonic sequences, and red shading denotes CISs that are >75% identical between mouse and human DNA. A total of 65 CISs >100 bp with >75% identity were identified.
Fig. 2.
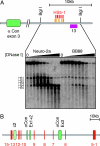
Identification of putative cis-regulatory elements by DNase I hypersensitivity. (A) (Upper) a diagram of the region downstream of the third constant-region exon indicating the positions of restriction enzyme sites, CIS (orange boxes), and Southern blot probes (purple boxes). Red boxes indicate identified DNase I HSs. (Lower) DNase I hypersensitivity assays on the region 30 kb downstream of the third constant region exon flanked by BglI sites on Neuro-2a and BB88 nuclei. Triangles indicate increasing concentrations of DNase I. Southern probe no. 13 was used. Five HSs were identified (HS5–1), which are prominent in Neuro-2a but weak in BB88. (B) Schematic showing the location of the 15 identified HSs in Neuro-2a cells. All but HS12 were also present in CAD cells. Except for the weak HS1 and HS4, none were present in BB88 cells.
Fig. 3.
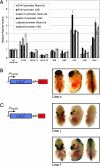
HS7 and HS5–1 are tissue-specific enhancers. (A) Reporter assays for constructs containing HSs cloned downstream of the SV40, _Pcdh_-α11, or α9 promoter for both Neuro-2a and CAD cells. The y axis represents relative reporter activation compared with the construct containing only the SV40, α11, or α9 promoter. (B) A schematic representing the construct used to test HS5–1 for enhancer activity in transgenic mice and the expression in a representative transgenic line in mouse embryos at E14.5. pHsp68, minimal promoter from heat-shock protein 68; pA, poly(A) signal. (C) A schematic representing the construct used to test HS7 for enhancer activity in transgenic mice and the expression in two representative transgenic lines in mouse embryos at E14.5. Abbreviations are the same as in B.
Fig. 4.
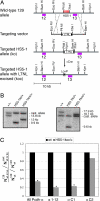
HS5–1 are necessary for high-level expression of mRNAs containing any Pcdh α V exon (α1-αC1), except αC2. (A) A schematic of the strategy used to delete HS5–1 in mouse ES cells. (Top to Bottom) The genomic organization of the part of the _Pcdh_-α locus containing HS5–1; the targeting vector with the LNTL cassette; the _Pcdh_-α cluster after homologous recombination (HS5–1ko); the _Pcdh_-α cluster after Cre-mediated excision of the LTNL cassette (HS5–1koc). Purple rectangles represent Southern blot probes used in B. Red blocks denote HS5–1. LTNL is the selection cassette containing the thymidine kinase and neomycin resistance genes flanked by loxP sites (black triangles). (B) Verification of the proper recombination of the locus with the targeting vector and subsequent Cre-mediated excision of the selection cassette using Southern blotting. (Left) Verification of the proper recombination of the left arm using BamHI and the Southern probe no. 12. (Right) Verification of the proper recombination of the right arm using KpnI and the Southern probe no. 11. The targeting cassette recombined with the 129 chromosome, as indicated. In both cases, the M. castaneus allele has a different size because of strain-specific polymorphisms. (C) Comparison of expression of _Pcdh_-α mRNAs from differentiated wild-type and HS5–1koc/+ ES cells. Transcripts from all _Pcdh_-α, α1–12, αC1, or αC2 were amplified by RT-PCR and cloned, and individual clones were sequenced to determine the chromosome of origin. The ratio of 129 to M. castaneus clones was then normalized to 1 for wild-type (wt) cells to account for natural differences in mRNA expression between the two chromosomes. For identity and number of clones sequenced, see
SI Table 5
. ∗, P < 0.001. For αC2 analysis, _P_ > 0.2. The P values were calculated by using the χ2 test.
Similar articles
- Relationship between DNA methylation states and transcription of individual isoforms encoded by the protocadherin-alpha gene cluster.
Kawaguchi M, Toyama T, Kaneko R, Hirayama T, Kawamura Y, Yagi T. Kawaguchi M, et al. J Biol Chem. 2008 May 2;283(18):12064-75. doi: 10.1074/jbc.M709648200. Epub 2008 Jan 18. J Biol Chem. 2008. PMID: 18204046 - Identification of the cluster control region for the protocadherin-beta genes located beyond the protocadherin-gamma cluster.
Yokota S, Hirayama T, Hirano K, Kaneko R, Toyoda S, Kawamura Y, Hirabayashi M, Hirabayashi T, Yagi T. Yokota S, et al. J Biol Chem. 2011 Sep 9;286(36):31885-95. doi: 10.1074/jbc.M111.245605. Epub 2011 Jul 19. J Biol Chem. 2011. PMID: 21771796 Free PMC article. - Comparative DNA sequence analysis of mouse and human protocadherin gene clusters.
Wu Q, Zhang T, Cheng JF, Kim Y, Grimwood J, Schmutz J, Dickson M, Noonan JP, Zhang MQ, Myers RM, Maniatis T. Wu Q, et al. Genome Res. 2001 Mar;11(3):389-404. doi: 10.1101/gr.167301. Genome Res. 2001. PMID: 11230163 Free PMC article. - The role and expression of the protocadherin-alpha clusters in the CNS.
Hirayama T, Yagi T. Hirayama T, et al. Curr Opin Neurobiol. 2006 Jun;16(3):336-42. doi: 10.1016/j.conb.2006.05.003. Epub 2006 May 11. Curr Opin Neurobiol. 2006. PMID: 16697637 Review. - Clustered protocadherin family.
Yagi T. Yagi T. Dev Growth Differ. 2008 Jun;50 Suppl 1:S131-40. doi: 10.1111/j.1440-169X.2008.00991.x. Epub 2008 Apr 22. Dev Growth Differ. 2008. PMID: 18430161 Review.
Cited by
- Protocadherin α (PCDHA) as a novel susceptibility gene for autism.
Anitha A, Thanseem I, Nakamura K, Yamada K, Iwayama Y, Toyota T, Iwata Y, Suzuki K, Sugiyama T, Tsujii M, Yoshikawa T, Mori N. Anitha A, et al. J Psychiatry Neurosci. 2013 May;38(3):192-8. doi: 10.1503/jpn.120058. J Psychiatry Neurosci. 2013. PMID: 23031252 Free PMC article. - Chromatin insulators: linking genome organization to cellular function.
Phillips-Cremins JE, Corces VG. Phillips-Cremins JE, et al. Mol Cell. 2013 May 23;50(4):461-74. doi: 10.1016/j.molcel.2013.04.018. Mol Cell. 2013. PMID: 23706817 Free PMC article. Review. - Smchd1 regulates a subset of autosomal genes subject to monoallelic expression in addition to being critical for X inactivation.
Mould AW, Pang Z, Pakusch M, Tonks ID, Stark M, Carrie D, Mukhopadhyay P, Seidel A, Ellis JJ, Deakin J, Wakefield MJ, Krause L, Blewitt ME, Kay GF. Mould AW, et al. Epigenetics Chromatin. 2013 Jul 2;6(1):19. doi: 10.1186/1756-8935-6-19. Epigenetics Chromatin. 2013. PMID: 23819640 Free PMC article. - Annotating regulatory elements by heterogeneous network embedding.
Lu Y, Feng Z, Zhang S, Wang Y. Lu Y, et al. Bioinformatics. 2022 May 13;38(10):2899-2911. doi: 10.1093/bioinformatics/btac185. Bioinformatics. 2022. PMID: 35561169 Free PMC article. - A protocadherin gene cluster regulatory variant is associated with nicotine withdrawal and the urge to smoke.
Jensen KP, Smith AH, Herman AI, Farrer LA, Kranzler HR, Sofuoglu M, Gelernter J. Jensen KP, et al. Mol Psychiatry. 2017 Feb;22(2):242-249. doi: 10.1038/mp.2016.43. Epub 2016 Apr 12. Mol Psychiatry. 2017. PMID: 27067016 Free PMC article.
References
- Lomvardas S, Barnea G, Pisapia DJ, Mendelsohn M, Kirkland J, Axel R. Cell. 2006;126:403–413. - PubMed
- Kohmura N, Senzaki K, Hamada S, Kai N, Yasuda R, Watanabe M, Ishii H, Yasuda M, Mishina M, Yagi T. Neuron. 1998;20:1137–1151. - PubMed
- Wu Q, Maniatis T. Cell. 1999;97:779–790. - PubMed
- Takei Y, Hamada S, Senzaki K, Mutoh T, Sugino H, Yagi T. Genomics. 2001;72:321–330. - PubMed
Publication types
MeSH terms
Substances
LinkOut - more resources
Full Text Sources
Molecular Biology Databases


