RSC mobilizes nucleosomes to improve accessibility of repair machinery to the damaged chromatin - PubMed (original) (raw)
RSC mobilizes nucleosomes to improve accessibility of repair machinery to the damaged chromatin
Eun Yong Shim et al. Mol Cell Biol. 2007 Mar.
Abstract
Repair of DNA double-strand breaks (DSBs) protects cells and organisms, as well as their genome integrity. Since DSB repair occurs in the context of chromatin, chromatin must be modified to prevent it from inhibiting DSB repair. Evidence supports the role of histone modifications and ATP-dependent chromatin remodeling in repair and signaling of chromosome DSBs. The key questions are, then, what the nature of chromatin altered by DSBs is and how remodeling of chromatin facilitates DSB repair. Here we report a chromatin alteration caused by a single HO endonuclease-generated DSB at the Saccharomyces cerevisiae MAT locus. The break induces rapid nucleosome migration to form histone-free DNA of a few hundred base pairs immediately adjacent to the break. The DSB-induced nucleosome repositioning appears independent of end processing, since it still occurs when the 5'-to-3' degradation of the DNA end is markedly reduced. The tetracycline-controlled depletion of Sth1, the ATPase of RSC, or deletion of RSC2 severely reduces chromatin remodeling and loading of Mre11 and Yku proteins at the DSB. Depletion of Sth1 also reduces phosphorylation of H2A, processing, and joining of DSBs. We propose that RSC-mediated chromatin remodeling at the DSB prepares chromatin to allow repair machinery to access the break and is vital for efficient DSB repair.
Figures
FIG. 1.
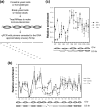
The MNase cleavage profile at the yeast MAT locus before and after a DSB. MNase sensitivity was measured by digesting chromatin with 45 U of MNase and quantifying the amount of undigested DNA with qPCR (a). The relative resistance of a given target sequence to MNase was measured by normalizing the PCR efficiency of each of a series of primers that anneal every 50 bp proximal (L series) or distal (R series) to the DNA surrounding the DSB with that of control primers (PRE1). The MNase cleavage profiles of JKM179 (b) and the G1-arrested JKM139 (MATa derivative of JKM179) (c) are shown at 0, 0.5, and 1.0 h following the addition of galactose to the culture medium. Shown below each graph are the hypothetical positions of nucleosomes inferred from this assay as well as indirect end-labeling and primer extension assays (Fig. 2; see Fig. S3 in the supplemental material). Each oval represents an individual nucleosome; blank ovals indicate mobilized nucleosomes, and the dotted ovals are the nucleosomes lost upon DSB induction. The arrow indicates the location of the HO-induced break. The average for three independent experiments is shown, along with the standard deviation.
FIG. 2.
Nucleosomes are repositioned to sites more distal from the DSB. Chromatin DNA isolated from cells induced with 1.0 h of HO expression (+) or with no induction (−) was partially digested with MNase and then deproteinized and fully digested with BamHI (a), HindIII (b), or EcoRI (c) to yield common end fragments. Southern blot hybridization was carried out using a radiolabeled probe that anneals 2 kb distal to the break (a) (+1680 to +2313 with respect to the HO cut), 1 kb distal (b) (+337 to +1211 relative to the HO cut), or 2 kb proximal (c) (−2606 to −2034 relative to the HO cut) to map the nucleosome positions adjacent to a DSB at the MAT locus. Molecular weight markers (M) and the MNase digest of naked DNA (naked) are shown for comparison. The arrows indicate the locations of the HO breaks. The inferred nucleosome positions are shown next to the panels of indirect end labeling.
FIG. 3.
The DNA is more accessible to restriction enzymes adjacent to the DSB. (a) Location of restriction enzyme recognition sequences surrounding a DSB at the MAT locus. (b) Graph summarizing the restriction enzyme digests of chromatin before and after the DSB. Chromatin DNA was digested by the enzymes listed in panel a, deproteinized, and then digested by one or two additional restriction enzymes. The DNA was separated by gel electrophoresis, and any changes in the accessibility of restriction endonucleases were analyzed quantitatively by Southern blot hybridization using a probe specific for the MAT locus. Percent cleavage was calculated by dividing the amount of signal of a cut fragment by the combined intensity of cut and uncut fragments (see Fig. S4 in the supplemental material), as quantified with a phosphorimager.
FIG. 4.
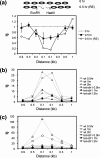
DNA in the region of the DSB becomes histone free and is a preferential target for Yku or Mre11 binding. ChIP assays were used to assess the levels of histone H3 (a) or Yku70 (b) and Mre11 (c) in the presence or absence of Sth1 at the DSB using an anti-H3 antibody (Abcam), an anti-Yku antibody (a gift from A. Tomkinson), and an anti-Mre11 antibody (a gift from P. Sung). Yeast cells grown in the preinduction medium were treated with 10 μg/ml doxycycline for 12 h or left untreated. Chromatin was isolated 0 and 0.5 h (a) or 0, 0.5, 1.0, and 1.5 h (b and c) after galactose addition, cross-linked with formaldehyde, and fragmented by extensive sonication or by restriction enzyme cleavage. After immunoprecipitation and reverse cross-linking, purified DNA was analyzed by qPCR using multiple sets of primers that anneal 0.1 kb to 0.9 kb proximal (L) or distal (R) to the DSB, as well as primers specific for the PRE1 gene situated on chromosome V as a control. PCR signals from each primer set at different durations of HO expression were quantified and plotted as a graph. IP represents the ratio of the histone H3, Yku70, or Mre11 PCR signal before and after HO induction, normalized by the PCR signal of the PRE1 control. Above the graph (a), the positions of recognition sites for EcoRV and HaeIII, two restriction enzymes used to fragment chromatin prior to immunoprecipitation by anti-histone H3 antibody, are shown. Each point is the average for at least two separate experiments. The standard deviation is shown.
FIG. 5.
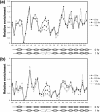
Lack of RSC reduces the chromatin remodeling at the DSB. The MNase cleavage profiles of the tet-Sth1 (SLY579) with 10 μg/ml doxycycline (A) or SLY403 (_rsc2_Δ) (B) are shown at 0, 0.5, and 1.0 h after galactose was added to the culture medium as described in Fig. 1. Inferred nucleosome positions before and after the DSB are shown below each graph. Each oval represents an individual nucleosome; the dotted ovals are the nucleosomes lost upon DSB induction. The arrow indicates the location of the HO-induced break. The average for three independent experiments is shown.
FIG. 6.
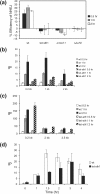
Depletion of RSC reduces phosphorylation of H2A. The level of Rsc1-FLAG at the DSB in the wild-type SLY1103 or SLY1101 (hta1-S129A hta2-S129A) (a), where damage-induced phosphorylation of carboxy-terminal H2A is blocked, or the level of phosphorylated H2A in cells that were replete or deficient in Sth1 (b) was determined using ChIP assays. Chromatin isolated from yeast cells grown in the preinduction medium with 10 μg/ml doxycycline for 12 h and HO expression induced by the addition of 2% galactose were cross-linked and immunoprecipitated with an anti-FLAG antibody (a) or a H2AX antibody (b). Purified DNA was analyzed by qPCR using multiple sets of primers. See the legend to Fig. 4 for the definition of IP.
FIG. 7.
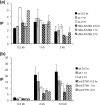
Depletion of Sth1 severely reduced joining and processing of DSB at the MAT locus. (A) NHEJ proficiency was assayed by using qPCR with oligonucleotides that anneal to each side of DSB. Cultures were induced to express HO for 1 h and switched to the YEP-glucose medium that shuts off HO expression. The percent NHEJ efficiency was calculated by the equation (Tx − _T_0)/(_Tun_− _T_0) × 100, using the amount of PCR product prior to HO expression (Tun), immediately after 1 h of HO expression (_T_0), and during the recovery following HO expression (TX), all of which were normalized by the control (PRE-1) PCR. In this assay, almost every surviving cell religated and restored the complete _MAT_α locus by precise end joining (25). Each point represents the average for three or more separate experiments. The standard deviation is shown. ChIP assays were used to assess the levels of RPA (b) or Rad51 (c) in the presence or absence of Sth1 at the DSB using an anti-RPA antibody (a gift from S. Brill) or anti-Rad51-antibody (a gift from P. Sung) and the level of Rad51 at the HML donor (d). Purified DNA was analyzed by qPCR using multiple sets of primers. See the legend to Fig. 4 for the definition of IP.
Similar articles
- The yeast chromatin remodeler RSC complex facilitates end joining repair of DNA double-strand breaks.
Shim EY, Ma JL, Oum JH, Yanez Y, Lee SE. Shim EY, et al. Mol Cell Biol. 2005 May;25(10):3934-44. doi: 10.1128/MCB.25.10.3934-3944.2005. Mol Cell Biol. 2005. PMID: 15870268 Free PMC article. - RSC functions as an early double-strand-break sensor in the cell's response to DNA damage.
Liang B, Qiu J, Ratnakumar K, Laurent BC. Liang B, et al. Curr Biol. 2007 Aug 21;17(16):1432-7. doi: 10.1016/j.cub.2007.07.035. Epub 2007 Aug 9. Curr Biol. 2007. PMID: 17689960 Free PMC article. - Distinct roles for SWR1 and INO80 chromatin remodeling complexes at chromosomal double-strand breaks.
van Attikum H, Fritsch O, Gasser SM. van Attikum H, et al. EMBO J. 2007 Sep 19;26(18):4113-25. doi: 10.1038/sj.emboj.7601835. Epub 2007 Aug 30. EMBO J. 2007. PMID: 17762868 Free PMC article. - Altering nucleosomes during DNA double-strand break repair in yeast.
Osley MA, Shen X. Osley MA, et al. Trends Genet. 2006 Dec;22(12):671-7. doi: 10.1016/j.tig.2006.09.007. Epub 2006 Sep 25. Trends Genet. 2006. PMID: 16997415 Review. - The Chromatin Landscape around DNA Double-Strand Breaks in Yeast and Its Influence on DNA Repair Pathway Choice.
Frigerio C, Di Nisio E, Galli M, Colombo CV, Negri R, Clerici M. Frigerio C, et al. Int J Mol Sci. 2023 Feb 7;24(4):3248. doi: 10.3390/ijms24043248. Int J Mol Sci. 2023. PMID: 36834658 Free PMC article. Review.
Cited by
- Dissection of Rad9 BRCT domain function in the mitotic checkpoint response to telomere uncapping.
Nnakwe CC, Altaf M, Côté J, Kron SJ. Nnakwe CC, et al. DNA Repair (Amst). 2009 Dec 3;8(12):1452-61. doi: 10.1016/j.dnarep.2009.09.010. Epub 2009 Oct 31. DNA Repair (Amst). 2009. PMID: 19880356 Free PMC article. - Real-time analysis of double-strand DNA break repair by homologous recombination.
Hicks WM, Yamaguchi M, Haber JE. Hicks WM, et al. Proc Natl Acad Sci U S A. 2011 Feb 22;108(8):3108-15. doi: 10.1073/pnas.1019660108. Epub 2011 Feb 3. Proc Natl Acad Sci U S A. 2011. PMID: 21292986 Free PMC article. - Inhibition of DNA double-strand break repair by the Ku heterodimer in mrx mutants of Saccharomyces cerevisiae.
Wasko BM, Holland CL, Resnick MA, Lewis LK. Wasko BM, et al. DNA Repair (Amst). 2009 Feb 1;8(2):162-9. doi: 10.1016/j.dnarep.2008.09.010. Epub 2008 Nov 18. DNA Repair (Amst). 2009. PMID: 18992851 Free PMC article. - Chromatin assembly factors Asf1 and CAF-1 have overlapping roles in deactivating the DNA damage checkpoint when DNA repair is complete.
Kim JA, Haber JE. Kim JA, et al. Proc Natl Acad Sci U S A. 2009 Jan 27;106(4):1151-6. doi: 10.1073/pnas.0812578106. Epub 2009 Jan 21. Proc Natl Acad Sci U S A. 2009. PMID: 19164567 Free PMC article. - Combined Interactions of Plant Homeodomain and Chromodomain Regulate NuA4 Activity at DNA Double-Strand Breaks.
Su WP, Hsu SH, Chia LC, Lin JY, Chang SB, Jiang ZD, Lin YJ, Shih MY, Chen YC, Chang MS, Yang WB, Hung JJ, Hung PC, Wu WS, Myung K, Liaw H. Su WP, et al. Genetics. 2016 Jan;202(1):77-92. doi: 10.1534/genetics.115.184432. Epub 2015 Nov 12. Genetics. 2016. PMID: 26564157 Free PMC article.
References
- Ai, X., and M. R. Parthun. 2004. The nuclear Hat1p/Hat2p complex: a molecular link between type B histone acetyltransferases and chromatin assembly. Mol. Cell 14:195-205. - PubMed
- Bassing, C. H., K. F. Chua, J. Sekiguchi, H. Suh, S. R. Whitlow, J. C. Fleming, B. C. Monroe, D. N. Ciccone, C. Yan, K. Vlasakova, D. M. Livingston, D. O. Ferguson, R. Scully, and F. W. Alt. 2002. Increased ionizing radiation sensitivity and genomic instability in the absence of histone H2AX. Proc. Natl. Acad. Sci. USA 99:8173-8178. - PMC - PubMed
- Bird, A. W., D. Y. Yu, M. G. Pray-Grant, Q. Qiu, K. E. Harmon, P. C. Megee, P. A. Grant, M. M. Smith, and M. F. Christman. 2002. Acetylation of histone H4 by Esa1 is required for DNA double-strand break repair. Nature 419:411-415. - PubMed
- Cairns, B. R. 2005. Chromatin remodeling complexes: strength in diversity, precision through specialization. Curr. Opin. Genet. Dev. 15:185-190. - PubMed
- Celeste, A., S. Petersen, P. J. Romanienko, O. Fernandez-Capetillo, H. T. Chen, O. A. Sedelnikova, B. Reina-San-Martin, V. Coppola, E. Meffre, M. J. Difilippantonio, C. Redon, D. R. Pilch, A. Olaru, M. Eckhaus, R. D. Camerini-Otero, L. Tessarollo, F. Livak, K. Manova, W. M. Bonner, M. C. Nussenzweig, and A. Nussenzweig. 2002. Genomic instability in mice lacking histone H2AX. Science 296:922-927. - PMC - PubMed
Publication types
MeSH terms
Substances
LinkOut - more resources
Full Text Sources
Molecular Biology Databases
