Hypocretin/orexin overexpression induces an insomnia-like phenotype in zebrafish - PubMed (original) (raw)
Comparative Study
Hypocretin/orexin overexpression induces an insomnia-like phenotype in zebrafish
David A Prober et al. J Neurosci. 2006.
Abstract
As many as 10% of humans suffer chronic sleep disturbances, yet the genetic mechanisms that regulate sleep remain essentially unknown. It is therefore crucial to develop simple and cost-effective vertebrate models to study the genetic regulation of sleep. The best characterized mammalian sleep/wake regulator is hypocretin/orexin (Hcrt), whose loss results in the sleep disorder narcolepsy and that has also been implicated in feeding behavior, energy homeostasis, thermoregulation, reward seeking, addiction, and maternal behavior. Here we report that the expression pattern and axonal projections of embryonic and larval zebrafish Hcrt neurons are strikingly similar to those in mammals. We show that zebrafish larvae exhibit robust locomotive sleep/wake behaviors as early as the fifth day of development and that Hcrt overexpression promotes and consolidates wakefulness and inhibits rest. Similar to humans with insomnia, Hcrt-overexpressing larvae are hyperaroused and have dramatically reduced abilities to initiate and maintain rest at night. Remarkably, Hcrt function is modulated by but does not require normal circadian oscillations in locomotor activity. Our zebrafish model of Hcrt overexpression indicates that the ancestral function of Hcrt is to promote locomotion and inhibit rest and will facilitate the discovery of neural circuits, genes, and drugs that regulate Hcrt function and sleep.
Figures
Figure 1.
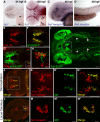
Hcrt and Hcrt receptor expression during embryonic and larval stages. A, B, hcrt mRNA is expressed in two bilaterally symmetric clusters of neurons in the posterior hypothalamus that each contains two to four neurons at 24 hpf (A, enlarged in inset) and 7–10 neurons at 120 hpf (B, enlarged in inset). At 48 hpf, hcrt receptor mRNA is expressed in discrete clusters of neurons in the forebrain, midbrain, and hindbrain (C) and in a row of neurons along the spinal cord (D). An Hcrt1 peptide-specific antibody (Ab) (E, F) and _hcrt_–EGFP transgenic fish (F–I) label Hcrt neurons and reveal extensive projections within the diencephalon (E, F, G, I), sparse projections to the forebrain (E, F), dense projections to the locus ceruleus [labeled with a dopamine β hydroxylase (DβH) antibody (G, H; arrowheads in I)], and projections down the spinal cord (arrows in I) at 120 hpf. EGFP-expressing Hcrt neurons are boxed in I to distinguish them from autofluorescence in the eyes and skin. The hcrt receptor is expressed in diencephalic dopaminergic neurons that express the dopamine transporter (dat) (J, K) and in noradrenergic neurons of the locus ceruleus that express dopamine β hydroxylase (d_β_h) (L, M). Boxed regions in G, J, and L are shown at higher magnification in H, K, and M. J is provided for orientation but was imaged from a different embryo than shown in K. Anterior is to the left. A, B, I–K are dorsal views, E–H are ventral views, and C, D, L, M are side views. Scale bars: A–G, I–L, 50 μm; H, M, 10 μm.
Figure 2.
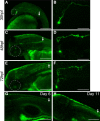
Time-lapse images of a developing Hcrt neuron. Transient injection of the _hcrt_–EGFP transgene labels a single Hcrt neuron, which was repeatedly imaged up to day 11 of development. As for all Hcrt neurons that we labeled in this manner, the axon initially projects ∼50 μm dorsally and then turns caudally and grows down the spinal cord (indicated with an arrow in A, C, E, G, H). By 30 hpf, the axon has already grown ∼400 μm (A) and eventually grows almost the entire length of the spinal cord (A–H). A, C, E are shown at higher magnification in B, D, F, revealing the development of dendritic and axonal arbors within the diencephalon. The eye is outlined in white for orientation. Anterior is to the left, and dorsal is up. Scale bars: A, C, E, G, H, 200 μm; B, D, F, 40 μm.
Figure 3.
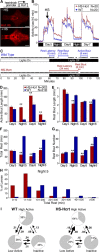
Hcrt overexpression consolidates active states and reduces rest. A, Ventral views of 7 d postfertilization brains labeled with an Hcrt1-specific antibody from HS-Hcrt transgenic larva that either were not (top) or were (bottom) heat shocked 48 h earlier. The non-heat-shocked brain shows endogenous Hcrt protein, whereas the heat-shocked brain shows high Hcrt levels throughout much of the brain. Scale bars, 100 μm. B, Hcrt overexpression increases locomotor activity. Each data point represents the average seconds of locomotor activity every 10 min for 20 larvae of each genotype. Behavioral recording was initiated on day 4 of development. HS-Hcrt and WT larvae were heat shocked for 1 h on day 5 (arrow). HS-Hcrt and WT larvae had similar activity levels before heat shock. Hcrt-overexpressing larvae became significantly more active than WT larvae a few hours after heat shock and remained more active for over 48 h. Note that larvae of both genotypes became very active for several minutes after lights out. The spike in activity during the afternoon on days 6 and 7 resulted from the addition of water to offset evaporation. C, Activity plots of representative WT and Hcrt-overexpressing larvae during 1 h preceding and after lights out. Black squares represent 1 min periods during which any locomotor activity is recorded and are referred to as active bouts. Rest latency refers to the time between lights out and the first 1 min period with no activity. Rest bout refers to a period of at least 1 min with no activity. D–H, Combined results from 10 independent experiments are shown. D–G, Each bar represents the mean ± SEM of 302 HS-Hcrt or 219 WT larvae. Hcrt overexpression increases active bout length (D), decreases rest bout length at night (E), decreases total time at rest (F), and decreases the number of rest bouts (G) (**p < 0.01 by two-tailed Student's _t_ test). **_H_**, Hcrt overexpression reduces rest in the entire larval population. The graph represents the distribution of total rest times for HS-Hcrt and WT larvae during the night after heat shock. **_I_**, Pie charts represent the percentage of time spent in each state, and arrows represent the frequencies of transitions between states during the night after the heat shock. HS-Hcrt larvae in the inactive and low-active states are more likely to transition to the high-active state than WT larvae, as represented by thicker arrows. Frequency values in bold are significantly different between HS-Hcrt and WT larvae (_p_ < 0.05 by two-tailed Student's _t_ test). For example, HS-Hcrt larvae spend 64 % of their time in the high-active state compared with 38% for WT, and the probability that WT larvae will transition from the inactive to the high-active state is only 13 versus 26 % for HS-Hcrt larvae. State transition frequencies do not add up to 1 because larvae often remain in the same state for > 1 min.
Figure 4.
Zebrafish larval locomotor activity assay. WT or HS-Hcrt transgenic fish are mated, embryos are collected, and individual larvae are placed in each of 80 wells of a 96-well plate on the fourth day of development. The plate is placed in a box that is continuously illuminated by infrared lights and is illuminated by white lights from 9:00 A.M. to 11:00 P.M. The larvae are monitored by an infrared camera, and the locomotor activity of each larva is recorded by a computer. Sample 40 s activity traces for a single larva during the day and at night are shown. Each movement of the larva is recorded as an upward deflection of the trace. When that deflection reaches a threshold (green), it is recorded as movement by the software. Zebrafish larvae move in short bursts and are mostly inactive at night. The small white deflections at night represent background noise. If necessary, larvae are genotyped by PCR after the experiment to identify HS-Hcrt larvae.
Figure 5.
Characterization of wild-type larval zebrafish sleep/wake locomotor behavior. A, B, Each data point represents the seconds of locomotor activity every 10 min for a single larva (A) or averaged for 80 larvae (B). As shown in previous studies (Hurd and Cahill, 2002; Kaneko and Cahill, 2005), we found that zebrafish larvae exhibit high locomotor activity levels during the day and low levels at night beginning on the fifth day of development. Larvae move in short bursts of activity followed by pauses, such that the total amount of time a single larva moves each minute is typically 4–10 s during the day and 0–1 s at night. C, D, Pulses of sudden darkness provide a non-invasive assay of arousal levels. Each data point represents the seconds of locomotor activity every 30 s for a single larva (C) or averaged for 40 larvae (D). Larvae were exposed to alternating 30 min periods of light and darkness during the night. Individual larvae respond to most dark stimuli (C). No attenuation in the response was observed after multiple light/dark stimuli.
Figure 6.
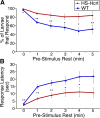
Hcrt overexpression decreases arousal threshold. A, Hcrt overexpression increases the response rate to sudden darkness. Each data point represents the percentage of larvae that become active within 15 s of sudden darkness, after continuous rest for at least the indicated periods of time. Nearly 100% of larvae of both genotypes respond to a dark stimulus if they were active during the previous minute. One minute of prestimulus rest reduces the response rate by 30% for WT larvae but only by 10% for Hcrt-overexpressing larvae. For each time point analyzed, significantly more Hcrt-overexpressing larvae respond than WT larvae (*p < 0.05; **_p_ < 0.01 by χ2 test). **_B_**, Hcrt overexpression reduces the response latency to sudden darkness. Each data point represents the average elapsed time between initiation of the dark stimulus and the onset of locomotor activity, after continuous rest for at least the indicated periods of time. Hcrt-overexpressing larvae respond significantly faster than WT larvae (*_p_ < 0.05; **_p_ < 0.01 by two-tailed Student's _t_ test). One minute of prestimulus rest increases the response latency by fivefold for WT larvae but only by threefold for Hcrt-overexpressing larvae. Even after at least 5 min of continuous rest, the response latency of WT larvae is twice that of Hcrt-overexpressing larvae. For both genotypes in **_A_** and **_B_**, responses after 1 or more minutes of prestimulus rest are all significantly different from those after 0 min of rest (_p_ < 0.001). Responses after 2 or more minutes of prestimulus rest are not significantly different from those after 1 min of rest (_p_ > 0.05). A total of 780 HS-Hcrt and 800 WT responses from three experiments were analyzed.
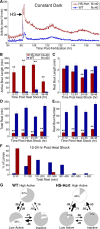
Figure 7.
Hcrt overexpression dramatically consolidates active states and reduces rest in constant dark conditions. A, Hcrt overexpression dramatically increases locomotor activity in DD conditions. Each data point represents the average seconds of locomotor activity every 10 min for 40 larvae of each genotype. Embryos were exposed to light for 2–3 h after fertilization but were then raised in the dark. Behavioral recording was initiated on day 4 of development, and larvae were heat shocked for 1 h on day 5 (arrow). Larvae exhibit activity levels in DD similar to those observed during the dark phase of a 14/10 h light/dark cycle. Hcrt-overexpressing larvae are slightly more active than WT larvae before heat shock, presumably attributable to leaky expression driven by the heat-shock promoter, but become significantly more active after heat shock. The slight oscillation in locomotor activity after heat shock likely results from the exposure to low levels of red light immediately before and after heat shock, to handling of the 96-well plate as it is transferred to the 37°C water bath, or to the temperature stimulus of the heat shock itself. B–E, Each bar represents the mean ± SEM of 40 larvae. Hcrt overexpression increases active bout length (B), decreases rest bout length (C), decreases total time at rest (D), and decreases the number of rest bouts (E) in DD conditions (**p < 0.01 by two-tailed Student's t test). F, Hcrt overexpression decreases rest in the entire larval population in DD conditions. The graph represents the distribution of total rest times for HS-Hcrt and WT larvae 12–24 h after heat shock. G, Pie charts represent the percentage of time spent in each state, and arrows represent the frequencies of transitions between states during the 12 h after the heat shock. HS-Hcrt larvae in the inactive and low-active states are more likely to transition to the high-active state than WT larvae, as represented by thicker arrows. All frequency values are significantly different between HS-Hcrt and WT larvae (p < 0.05 by two-tailed Student's t test).
Similar articles
- Genetic ablation of hypocretin neurons alters behavioral state transitions in zebrafish.
Elbaz I, Yelin-Bekerman L, Nicenboim J, Vatine G, Appelbaum L. Elbaz I, et al. J Neurosci. 2012 Sep 12;32(37):12961-72. doi: 10.1523/JNEUROSCI.1284-12.2012. J Neurosci. 2012. PMID: 22973020 Free PMC article. - The Role and Mechanisms of the Hypocretin System in Zebrafish (Danio rerio).
Dyachuk V. Dyachuk V. Int J Mol Sci. 2024 Dec 30;26(1):256. doi: 10.3390/ijms26010256. Int J Mol Sci. 2024. PMID: 39796111 Free PMC article. Review. - Sleep-wake regulation and hypocretin-melatonin interaction in zebrafish.
Appelbaum L, Wang GX, Maro GS, Mori R, Tovin A, Marin W, Yokogawa T, Kawakami K, Smith SJ, Gothilf Y, Mignot E, Mourrain P. Appelbaum L, et al. Proc Natl Acad Sci U S A. 2009 Dec 22;106(51):21942-7. doi: 10.1073/pnas.906637106. Epub 2009 Dec 4. Proc Natl Acad Sci U S A. 2009. PMID: 19966231 Free PMC article. - The Hypocretin/Orexin Neuronal Networks in Zebrafish.
Elbaz I, Levitas-Djerbi T, Appelbaum L. Elbaz I, et al. Curr Top Behav Neurosci. 2017;33:75-92. doi: 10.1007/7854_2016_59. Curr Top Behav Neurosci. 2017. PMID: 28012092 Review. - The evolutionarily conserved miRNA-137 targets the neuropeptide hypocretin/orexin and modulates the wake to sleep ratio.
Holm A, Possovre ML, Bandarabadi M, Moseholm KF, Justinussen JL, Bozic I, Lemcke R, Arribat Y, Amati F, Silahtaroglu A, Juventin M, Adamantidis A, Tafti M, Kornum BR. Holm A, et al. Proc Natl Acad Sci U S A. 2022 Apr 26;119(17):e2112225119. doi: 10.1073/pnas.2112225119. Epub 2022 Apr 22. Proc Natl Acad Sci U S A. 2022. PMID: 35452310 Free PMC article.
Cited by
- Morphological and Physiological Interactions Between GnRH3 and Hypocretin/Orexin Neuronal Systems in Zebrafish (Danio rerio).
Zhao Y, Singh C, Prober DA, Wayne NL. Zhao Y, et al. Endocrinology. 2016 Oct;157(10):4012-4020. doi: 10.1210/en.2016-1381. Epub 2016 Aug 17. Endocrinology. 2016. PMID: 27533887 Free PMC article. - Circadian modulation of dopamine levels and dopaminergic neuron development contributes to attention deficiency and hyperactive behavior.
Huang J, Zhong Z, Wang M, Chen X, Tan Y, Zhang S, He W, He X, Huang G, Lu H, Wu P, Che Y, Yan YL, Postlethwait JH, Chen W, Wang H. Huang J, et al. J Neurosci. 2015 Feb 11;35(6):2572-87. doi: 10.1523/JNEUROSCI.2551-14.2015. J Neurosci. 2015. PMID: 25673850 Free PMC article. - Large-scale Analysis of Sleep in Zebrafish.
Lee DA, Oikonomou G, Prober DA. Lee DA, et al. Bio Protoc. 2022 Feb 5;12(3):e4313. doi: 10.21769/BioProtoc.4313. eCollection 2022 Feb 5. Bio Protoc. 2022. PMID: 35284597 Free PMC article. - Circadian and homeostatic regulation of structural synaptic plasticity in hypocretin neurons.
Appelbaum L, Wang G, Yokogawa T, Skariah GM, Smith SJ, Mourrain P, Mignot E. Appelbaum L, et al. Neuron. 2010 Oct 6;68(1):87-98. doi: 10.1016/j.neuron.2010.09.006. Neuron. 2010. PMID: 20920793 Free PMC article. - From behavior to circuit modeling of light-seeking navigation in zebrafish larvae.
Karpenko S, Wolf S, Lafaye J, Le Goc G, Panier T, Bormuth V, Candelier R, Debrégeas G. Karpenko S, et al. Elife. 2020 Jan 2;9:e52882. doi: 10.7554/eLife.52882. Elife. 2020. PMID: 31895038 Free PMC article.
References
- Abrahamson EE, Leak RK, Moore RY. The suprachiasmatic nucleus projects to posterior hypothalamic arousal systems. NeuroReport. 2001;12:435–440. - PubMed
- American Academy of Sleep Medicine. Chicago: American Academy of Sleep Medicine; 2001. ICSD—International classification of sleep disorders, revised: diagnostic and coding manual.
- Aston-Jones G, Chen S, Zhu Y, Oshinsky ML. A neural circuit for circadian regulation of arousal. Nat Neurosci. 2001;4:732–738. - PubMed
- Bonnet MH, Arand DL. Activity, arousal, and the MSLT in patients with insomnia. Sleep. 2000;23:205–212. - PubMed
- Borgland SL, Taha SA, Sarti F, Fields HL, Bonci A. Orexin A in the VTA is critical for the induction of synaptic plasticity and behavioral sensitization to cocaine. Neuron. 2006;49:589–601. - PubMed
Publication types
MeSH terms
Substances
LinkOut - more resources
Full Text Sources
Other Literature Sources
Medical
Molecular Biology Databases
Research Materials
