Fine tuning of globin gene expression by DNA methylation - PubMed (original) (raw)
Fine tuning of globin gene expression by DNA methylation
Alon Goren et al. PLoS One. 2006.
Abstract
Expression patterns in the globin gene cluster are subject to developmental regulation in vivo. While the gamma(A) and gamma(G) genes are expressed in fetal liver, both are silenced in adult erythrocytes. In order to decipher the role of DNA methylation in this process, we generated a YAC transgenic mouse system that allowed us to control gamma(A) methylation during development. DNA methylation causes a 20-fold repression of gamma(A) both in non-erythroid and adult erythroid cells. In erythroid cells this modification works as a dominant mechanism to repress gamma gene expression, probably through changes in histone acetylation that prevent the binding of erythroid transcription factors to the promoter. These studies demonstrate that DNA methylation serves as an elegant in vivo fine-tuning device for selecting appropriate genes in the globin locus. In addition, our findings provide a mechanism for understanding the high levels of gamma-globin transcription seen in patients with Hereditary Persistence of Fetal Hemoglobin, and help explain why 5azaC and butyrate compounds stimulate gamma-globin expression in patients with beta-hemoglobinopathies.
Conflict of interest statement
Competing Interests: The authors have declared that no competing interests exist.
Figures
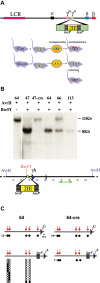
Figure 1. Programmed methylation of the human γA-globin promoter
A. Two IEs (yellow) bounded by loxP elements (stippled black) were inserted into the γA promoter region of a YAC containing the human β-globin locus , and this was used to generate transgenic mice that were then crossed with two different cre-expressing lines. In the first line (Cre) , cre is expressed (red) prior to implantation. In mice carrying this construct the IE is deleted before the wave of de novo methylation, and surrounding CpG sites thus become methylated (red circles). The second cre-expressing line carries interferon-inducible cre . In these mice (Mx-cre), the IE remains present during implantation and protects adjacent regions from methylation. By treating adult animals with polyI-polyC, cre activity could be induced (red) and the IE removed, generating an unmethylated version of the transgene. B. Tail DNA from four transgenic founders (lines 47, 64, 66 and 113) was cut with AvrII with or without the methylation sensitive restriction enzyme BsrFI, and subjected to Southern blotting using a radioactive probe (green arrow). Line 47 was crossed with cre mice and offspring analyzed in the same way. C. The region upstream of the γA and γG coding sequences (blue triangles) was analyzed for CpG methylation using the bisulfite technique. To this end we generated MEFs from line 64 (IE present at time of implantation) and infected them with an adenovirus that expresses Cre activity. Alternatively, we derived MEFs from line 64 mice crossed with Cre (IE removed prior to implantation). Five CpG residues were analyzed for methylation in the γG promoter. The normal γA promoter also carries 5 CpGs, but one is replaced by the inserted loxP element. Following bisulfite treatment, PCR products were cloned and subjected to sequencing. Each row represents a single molecule. Black circles indicate a methylated CpG, whereas open circles indicate a lack of methylation. The numbers in the margin indicate how many clones were fully methylated.
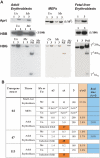
Figure 2. Effect of DNA methylation on gene expression
A. RNA from purified adult or fetal liver erythroblasts and MEFs from Cre (γA promoter methylated) or Mx-cre (γA promoter unmethylated) crossed transgenic (lines 47, 64 or 113)) mice were subjected to semi-quantitative RT-PCR on 1 or 3 µl samples to detect human β (HBB) or γ(HBG)-globin RNA. We measured Aprt expression to control for the amount of cDNA in the reaction. Genes expressed at high levels were quantitated by diluting the input sample (e.g. 1/105 for Aprt in MEFs). In order to distinguish between the two γ genes, we took advantage of a PstI restriction site that is present in γA and not γG. A smaller induction of γA was observed in line 66 which is only partially unmethylated at the promoter (data not shown). The degree of IE excision in purified erythroblasts from induced Mx-cre carrying mice was found to be >90% by PCR analysis. The data for fetal erythroblasts was taken from an animal with a “methylated” γA gene, but we have demonstrated that it is indeed unmethylated in fetal liver (data not shown), as expected. B. Quantitative analysis of RNA. Levels of globin expression were obtained from dilution analysis and compared to Aprt (set to 1) in the same cells. Each experiment was repeated 2–3 times (coefficient of variance = 14%). γ/γ+β was calculated on the basis of total γ globin (γA+γG). Results (average of 3 experiments) for real time PCR are included for some samples. The degree of γ globin induction is shown for adult erythroblast cells.
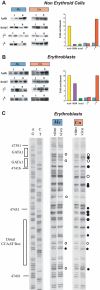
Figure 3. Effect of DNA methylation on promoter structure
Mononucleosomes were prepared from either non-erythroid (A) or erythroid (B) cells taken from Cre (methylated) and Mx-cre (unmethylated) founder (64) transgene crosses and subjected to ChIP analysis using anti-Ac-H4. Input (I) and bound (B) DNA fractions were used for semi-quantitative PCR on 1 or 3 µl samples using primer sets specific for the γG or loxP-inserted γA promoter regions. For each ChIP preparation, the Acta1 gene (green) was assayed as a negative control and the Actb gene (yellow) as a positive control. The results are summarized in graphic form after normalizing to Acta1 (green) enrichment (set at 1.0) (coefficient of variance = 17%). The results for the Cre (blue) and Mx-cre (red) mice are shown. Results for β globin are presented for comparison. The data shown for non-erythroid cells was obtained using mononucleosomes from MEFs, but the graph summarizes results from 3–4 ChIP experiments on both MEFs and lymphocytes. (C) In vivo footprinting of γ promoter. Erythroblasts (in vivo) or purified erythroblast DNA (in vitro) from mice carrying either a methylated or unmethylated γA promoter were treated with DMS. LMPCR gel. Maxam-Gilbert lanes (AG and CT) are sequencing controls. The numbers are according to PubMed accession number NG_000007. Putative protein factor binding regions (rectangles) , DMS footprints, as in vivo protected (open circle) or hyper-reactive (closed circle) nucleotides, are indicated. The sizes of the circles represent relative differences in footprint intensities. DMS footprinting on spleen lymphocytes did not show any hyperreactive sites on unmethylated DNA, but did reveal some slight reactivity over the distal CCAAT box on methylated DNA.
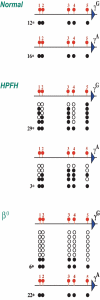
Figure 4. γ promoter methylation pattern in patients with HPFH
The γA and γG promoter regions were analyzed for CpG methylation on individual clones by the bisulfite technique. To this end we used Fibach culture erythroblasts derived from normal individuals, as well as heterozygote HPFH1 or β0 Thalassemia (IVS-II-I, G⇑A) patients. Black circles indicate methylated CpGs, whereas open circles indicate a lack of methylation. The numbers in the margin indicate how many clones were fully methylated.
Figure 5. IE induces undermethylation in transgenic mice
We made transgenic embryos (12.5 dpc) using either a plasmid that contains the normal promoter of the human γA-globin gene (-IE), or a plasmid that contains the promoter of the human γA-globin gene modified to harbor a dimer of the IE bounded by two lox elements (+2IE) 40 bp upstream to the γA transcription start site, and tested total founder embryonic DNA for methylation at specific restriction sites by southern blot analysis. This plasmid (+2IE) was later used as a template for homologous recombination in the YAC (see methods). The map indicates the restriction site locations according to PubMed accession number NG_00007. Bold marked restriction enzymes are methylation sensitive. Total founder embryo DNA was digested with HindIII alone or together with CfoI, or alternatively with StuI/XbaI alone or together with HpaII, MspI or AvaI. Southern-blot analysis was performed using probes 5′ or 3′ as labeled. The sizes of expected bands are indicated on the autoradiogram. Data shown are representative of results obtained with several transgenic founder mice for each construct. From this experiment, we conclude that a double IE is capable of inducing undermethylation over a distance of at least 500 bp in each direction.
Similar articles
- Methyl binding domain protein 2 mediates gamma-globin gene silencing in adult human betaYAC transgenic mice.
Rupon JW, Wang SZ, Gaensler K, Lloyd J, Ginder GD. Rupon JW, et al. Proc Natl Acad Sci U S A. 2006 Apr 25;103(17):6617-22. doi: 10.1073/pnas.0509322103. Epub 2006 Apr 11. Proc Natl Acad Sci U S A. 2006. PMID: 16608912 Free PMC article. - Epigenetic regulation of fetal globin gene expression in adult erythroid cells.
Ginder GD. Ginder GD. Transl Res. 2015 Jan;165(1):115-25. doi: 10.1016/j.trsl.2014.05.002. Epub 2014 May 11. Transl Res. 2015. PMID: 24880147 Free PMC article. Review. - Epigenetic inactivation of ERF reactivates γ-globin expression in β-thalassemia.
Bao X, Zhang X, Wang L, Wang Z, Huang J, Zhang Q, Ye Y, Liu Y, Chen D, Zuo Y, Liu Q, Xu P, Huang B, Fang J, Lao J, Feng X, Li Y, Kurita R, Nakamura Y, Yu W, Ju C, Huang C, Mohandas N, Li D, Zhao C, Xu X. Bao X, et al. Am J Hum Genet. 2021 Apr 1;108(4):709-721. doi: 10.1016/j.ajhg.2021.03.005. Epub 2021 Mar 17. Am J Hum Genet. 2021. PMID: 33735615 Free PMC article. - DNA methylation patterns of β-globin cluster in β-thalassemia patients.
Bao X, Zuo Y, Chen D, Zhao C. Bao X, et al. Clin Epigenetics. 2020 Dec 3;12(1):187. doi: 10.1186/s13148-020-00987-2. Clin Epigenetics. 2020. PMID: 33272312 Free PMC article. - Interpreting elevated fetal hemoglobin in pathology and health at the basic laboratory level: new and known γ- gene mutations associated with hereditary persistence of fetal hemoglobin.
Amato A, Cappabianca MP, Perri M, Zaghis I, Grisanti P, Ponzini D, Di Biagio P. Amato A, et al. Int J Lab Hematol. 2014 Feb;36(1):13-9. doi: 10.1111/ijlh.12094. Epub 2013 Apr 29. Int J Lab Hematol. 2014. PMID: 23621512 Review.
Cited by
- DNA methylation dynamics in health and disease.
Bergman Y, Cedar H. Bergman Y, et al. Nat Struct Mol Biol. 2013 Mar;20(3):274-81. doi: 10.1038/nsmb.2518. Nat Struct Mol Biol. 2013. PMID: 23463312 Review. - Evidence for a bigenic chromatin subdomain in regulation of the fetal-to-adult hemoglobin switch.
Beauchemin H, Trudel M. Beauchemin H, et al. Mol Cell Biol. 2009 Mar;29(6):1635-48. doi: 10.1128/MCB.01735-08. Epub 2008 Dec 29. Mol Cell Biol. 2009. PMID: 19114559 Free PMC article. - Exploring epigenetic and microRNA approaches for γ-globin gene regulation.
Starlard-Davenport A, Fitzgerald A, Pace BS. Starlard-Davenport A, et al. Exp Biol Med (Maywood). 2021 Nov;246(22):2347-2357. doi: 10.1177/15353702211028195. Epub 2021 Jul 22. Exp Biol Med (Maywood). 2021. PMID: 34292080 Free PMC article. Review. - Anti-malarial effect of gum arabic.
Ballal A, Bobbala D, Qadri SM, Föller M, Kempe D, Nasir O, Saeed A, Lang F. Ballal A, et al. Malar J. 2011 May 20;10:139. doi: 10.1186/1475-2875-10-139. Malar J. 2011. PMID: 21599958 Free PMC article. - PRMT5-mediated methylation of histone H4R3 recruits DNMT3A, coupling histone and DNA methylation in gene silencing.
Zhao Q, Rank G, Tan YT, Li H, Moritz RL, Simpson RJ, Cerruti L, Curtis DJ, Patel DJ, Allis CD, Cunningham JM, Jane SM. Zhao Q, et al. Nat Struct Mol Biol. 2009 Mar;16(3):304-311. doi: 10.1038/nsmb.1568. Epub 2009 Feb 22. Nat Struct Mol Biol. 2009. PMID: 19234465 Free PMC article.
References
- Brandeis M, Ariel M, Cedar H. Dynamics of DNA methylation during development. BioEssays. 1993;15:1–5. - PubMed
- Keshet I, Lieman-Hurwitz J, Cedar H. DNA methylation affects the formation of active chromatin. Cell. 1986;44:535–543. - PubMed
- Hashimshony T, Zhang J, Keshet I, Bustin M, Cedar H. The role of DNA methylation in setting up chromatin structure during development. Nature Genet. 2003;34:187–192. - PubMed
- Bird AP. Gene number, noise reduction and biological complexity. Trends Genet. 1995;11:94–100. - PubMed
- Yeivin A, Razin A. Gene methylation patterns and expression. In: Jost JP, Saluz HP, editors. DNA Methylation: Molecular Biology and Biological Significance, Basel: Birkhauser Verlag; 1993. pp. 523–568.
Publication types
MeSH terms
Substances
LinkOut - more resources
Full Text Sources
Molecular Biology Databases


