A unique configuration of genome-wide DNA methylation patterns in the testis - PubMed (original) (raw)
A unique configuration of genome-wide DNA methylation patterns in the testis
C C Oakes et al. Proc Natl Acad Sci U S A. 2007.
Abstract
In the mammalian lifecycle, the two periods of genome-wide epigenetic reprogramming are in the early embryo, when somatic patterns are set, and during germ cell development. Although some differences between the reprogrammed states of somatic and germ cells have been reported, overall patterns of genomic methylation are considered to be similar. Using restriction landmark genomic scanning to examine approximately 2,600 loci distributed randomly throughout the genome, we find that the methylation status of testicular DNA is highly distinct, displaying eightfold the number of hypomethylated loci relative to somatic tissues. Identification and analysis of >300 loci show that these regions are generally located within nonrepetitive sequences that are away from CpG islands and 5' regions of genes. We show that a contributing factor for these differences is that the methylation state of non-CpG-island DNA is correlated with the regional level of GC content within chromosomes and that this relationship is inverted between the testis and somatic tissues. We also show that in Dnmt3L-deficient mice, which exhibit infertility associated with abnormal chromosomal structures in germ cells, this unique testicular DNA methylation pattern is not established. These special properties of testicular DNA point to a broad, distinct epigenetic state that may be involved in maintaining a unique chromosomal structure in male germ cells.
Conflict of interest statement
The authors declare no conflict of interest.
Figures
Fig. 1.
RLGS analysis of tissue-specific DNA methylation. Two-dimensional spot profiles are produced by digestion of genomic DNA with the methylation-sensitive restriction enzyme, NotI, followed by radioactive end-labeling. A spot is produced if the site is unmethylated and absent if methylated. (a) Enlargements of liver, intestine, brain, and testis RLGS profiles. Black and white arrowheads denote hyper- and hypomethylated spots, respectively. (b) Summary of RLGS spot data. A total of 1,945 spots are visible over four tissues; 241display differential intensity between tissues. Consistent methylation of ≈1/3 of all spots is predicted by subtracting the total visible spots from the total number of spots calculated by virtual RLGS analysis of the mouse genome. (c) Tissue-specific breakdown of DM spots. Hyper- and hypomethylated spots can occur either in one tissue or can be shared. More than half of all observed DM spots are testis-specific.
Fig. 2.
Identification and confirmation of the genomic locations of RLGS spots. (a) The identity of 260 unmethylated, methylated, or DM spots was established by observing enhanced spot intensity on RLGS gels produced by mixing plasmid or BAC clone DNA with genomic testis DNA as background. (b) Summary of identified spots and the corresponding loci. Forty spots were found to originate from the same NotI site as another spot and were removed from the data set to ensure that each spot relates to a single locus. (c) Verification of the DNA methylation status of identified loci by using the qAMP assay (25). Real-time PCR amplification of the region after digestion with the methylation-sensitive enzymes HhaI(H) and NotI(N) and the methylation-dependent enzyme McrBC(M) confirms the testis-specific hypomethylation of the 4Bx2 locus using all three enzymes. The methylation status of a total of 36 identified loci was verified by using this method.
Fig. 3.
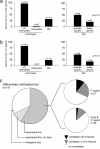
Analysis of identified loci. (a and b) The positional distribution of all identified loci with respect to CpG islands (a) and 5′ regions (b). All identified loci were grouped according to their DNA methylation pattern in different tissues as being either unmethylated, methylated or DM. DM loci are subdivided into somatic- and testis-specific DM loci. The percentages of loci from each group that are found in CpG islands and within 5′ regions are shown. Proportionally fewer testis-specific DM loci are within CpG islands and 5′ regions (P < 0.05). (c) The correlation of expression of known genes with tissue-specific methylation of DM loci. Approximately 2/3 of all DM loci are located within or near known genes. Relative levels of tissue-specific expression are known for 66 of these genes in the GNF gene-expression database. Tissue-specific hypomethylation correlated with expression in only a minority of DM loci in the vicinity of genes.
Fig. 4.
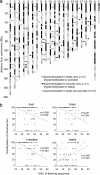
Analysis of non-CpG-island hypomethylated loci. (a) The chromosomal locations of non-CpG-island loci that are hypomethylated in testis, somatic tissues, or both (open, black, and gray triangles, respectively) are shown. (b) Correlation analysis of all hypomethylated non-CpG-island loci comparing the percent GC of 50 Kb of flanking sequence with the level of methylation as assessed by visual inspection of each RLGS spot in different tissues. The relationship between methylation and GC content is inverted in testicular DNA. Ideograms are adapted from the University of California, Santa Cruz, CA, genome browser.
Fig. 5.
DNA methylation analysis of non-CpG-island DNA on chromosomes 4, 10, 17, and X using the qAMP assay. Primers were designed to flank McrBC and HhaI or HpaII restriction sites placed at roughly 5-Mb intervals along each chromosome. Amplified regions were chosen only on the basis of the sequence not being in the proximity of a CpG island or a known 5′ region, or within a repetitive sequence. (a) Analysis of chromosome 4. The percentage of DNA methylation of each amplified region in liver (black dash) and testis DNA (gray dash) is shown. Differences in methylation are shown by arrows. The ideogram and GC percentage are shown, as are the positions of hyper- and hypomethylated loci identified by using RLGS. (b) The average difference in percentage of methylation of all DM regions analyzed on each chromosome shows an overall decreased level of methylation in testis vs. liver in three of four chromosomes. Unchanged regions (<10% difference) were excluded. (c) The correlation between the difference in methylation in each region on all three chromosomes and the GC percent of flanking sequence shows a lower relative level of methylation in the testis in sequences of lower GC content. Chromosome 4 ideogram and percentage of GC were obtained from the University of California, Santa Cruz, CA, genome browser.
Fig. 6.
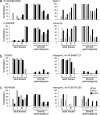
Levels of DNA methylation in _Dnmt3L_-deficient spermatogonia and adult tissues. The percent methylation of DM RLGS loci that are hypermethylated in testis (a), hypomethylated in testis (b), and somatic-specific DM (c) was determined by using qAMP. Loci that are hypermethylated in the testis fail to gain normal levels of methylation in _Dnmt3L_-deficient spermatogonia. Analyzed loci were all in non-5′ regions. L, liver; I, intestine; B, brain; T, testis.
Similar articles
- Developmental acquisition of genome-wide DNA methylation occurs prior to meiosis in male germ cells.
Oakes CC, La Salle S, Smiraglia DJ, Robaire B, Trasler JM. Oakes CC, et al. Dev Biol. 2007 Jul 15;307(2):368-79. doi: 10.1016/j.ydbio.2007.05.002. Epub 2007 May 8. Dev Biol. 2007. PMID: 17559830 - Loss of spermatogonia and wide-spread DNA methylation defects in newborn male mice deficient in DNMT3L.
La Salle S, Oakes CC, Neaga OR, Bourc'his D, Bestor TH, Trasler JM. La Salle S, et al. BMC Dev Biol. 2007 Sep 18;7:104. doi: 10.1186/1471-213X-7-104. BMC Dev Biol. 2007. PMID: 17875220 Free PMC article. - Methylation profile of DNA repetitive elements in human testicular germ cell tumor.
Ushida H, Kawakami T, Minami K, Chano T, Okabe H, Okada Y, Okamoto K. Ushida H, et al. Mol Carcinog. 2012 Sep;51(9):711-22. doi: 10.1002/mc.20831. Epub 2011 Aug 1. Mol Carcinog. 2012. PMID: 21809391 - Dynamic regulation of DNA methylation during mammalian development.
Guibert S, Forné T, Weber M. Guibert S, et al. Epigenomics. 2009 Oct;1(1):81-98. doi: 10.2217/epi.09.5. Epigenomics. 2009. PMID: 22122638 Review. - Epigenetics in spermatogenesis.
Trasler JM. Trasler JM. Mol Cell Endocrinol. 2009 Jul 10;306(1-2):33-6. doi: 10.1016/j.mce.2008.12.018. Epub 2009 Jan 20. Mol Cell Endocrinol. 2009. PMID: 19481683 Review.
Cited by
- Tissue-specific variation in DNA methylation levels along human chromosome 1.
De Bustos C, Ramos E, Young JM, Tran RK, Menzel U, Langford CF, Eichler EE, Hsu L, Henikoff S, Dumanski JP, Trask BJ. De Bustos C, et al. Epigenetics Chromatin. 2009 Jun 8;2(1):7. doi: 10.1186/1756-8935-2-7. Epigenetics Chromatin. 2009. PMID: 19505295 Free PMC article. - Biomolecular condensates: organizers of cellular biochemistry.
Banani SF, Lee HO, Hyman AA, Rosen MK. Banani SF, et al. Nat Rev Mol Cell Biol. 2017 May;18(5):285-298. doi: 10.1038/nrm.2017.7. Epub 2017 Feb 22. Nat Rev Mol Cell Biol. 2017. PMID: 28225081 Free PMC article. Review. - DNA methylation and gene expression dynamics during spermatogonial stem cell differentiation in the early postnatal mouse testis.
Kubo N, Toh H, Shirane K, Shirakawa T, Kobayashi H, Sato T, Sone H, Sato Y, Tomizawa S, Tsurusaki Y, Shibata H, Saitsu H, Suzuki Y, Matsumoto N, Suyama M, Kono T, Ohbo K, Sasaki H. Kubo N, et al. BMC Genomics. 2015 Aug 20;16(1):624. doi: 10.1186/s12864-015-1833-5. BMC Genomics. 2015. PMID: 26290333 Free PMC article. - Crosstalk Between Oxidative Stress and Epigenetics: Unveiling New Biomarkers in Human Infertility.
Dutta S, Sengupta P, Mottola F, Das S, Hussain A, Ashour A, Rocco L, Govindasamy K, Rosas IM, Roychoudhury S. Dutta S, et al. Cells. 2024 Nov 7;13(22):1846. doi: 10.3390/cells13221846. Cells. 2024. PMID: 39594595 Free PMC article. Review. - Analysing the sperm epigenome: roles in early embryogenesis and assisted reproduction.
Schagdarsurengin U, Paradowska A, Steger K. Schagdarsurengin U, et al. Nat Rev Urol. 2012 Nov;9(11):609-19. doi: 10.1038/nrurol.2012.183. Epub 2012 Oct 9. Nat Rev Urol. 2012. PMID: 23045264 Review.
References
- Reik W, Dean W, Walter J. Science. 2001;293:1089–1093. - PubMed
- Bourc'his D, Bestor TH. Nature. 2004;431:96–99. - PubMed
- Kaneda M, Okano M, Hata K, Sado T, Tsujimoto N, Li E, Sasaki H. Nature. 2004;429:900–903. - PubMed
- Hayashi K, Yoshida K, Matsui Y. Nature. 2005;438:374–378. - PubMed
- Ferguson-Smith AC, Surani MA. Science. 2001;293:1086–1089. - PubMed
Publication types
MeSH terms
Substances
LinkOut - more resources
Full Text Sources
Other Literature Sources
Miscellaneous


