Convergence of TCR and cytokine signaling leads to FOXO3a phosphorylation and drives the survival of CD4+ central memory T cells - PubMed (original) (raw)
. 2007 Jan 22;204(1):79-91.
doi: 10.1084/jem.20061681. Epub 2006 Dec 26.
Bader Yassine-Diab, Julien Van grevenynghe, Roland Somogyi, Larry D Greller, Dominic Gagnon, Sylvain Gimmig, Peter Wilkinson, Yu Shi, Mark J Cameron, Roberto Campos-Gonzalez, Robert S Balderas, David Kelvin, Rafick-Pierre Sekaly, Elias K Haddad
Affiliations
- PMID: 17190839
- PMCID: PMC2118424
- DOI: 10.1084/jem.20061681
Convergence of TCR and cytokine signaling leads to FOXO3a phosphorylation and drives the survival of CD4+ central memory T cells
Catherine Riou et al. J Exp Med. 2007.
Abstract
The molecular events involved in the establishment and maintenance of CD4+ central memory and effector memory T cells (TCM and TEM, respectively) are poorly understood. In this study, we demonstrate that ex vivo isolated TCM are more resistant to both spontaneous and Fas-induced apoptosis than TEM and have an increased capacity to proliferate and persist in vitro. Using global gene expression profiling, single cell proteomics, and functional assays, we show that the survival of CD4+ TCM depends, at least in part, on the activation and phosphorylation of signal transducer and activator of transcription 5a (STAT5a) and forkhead box O3a (FOXO3a). TCM showed a significant increase in the levels of phosphorylation of STAT5a compared with TEM in response to both IL-2 (P<0.04) and IL-7 (P<0.002); the latter is well known for its capacity to enhance T cell survival. Moreover, ex vivo TCM express higher levels of the transcriptionally inactive phosphorylated forms of FOXO3a and concomitantly lower levels of the proapoptotic FOXO3a target, Bim. Experiments aimed at blocking FOXO3a phosphorylation confirmed the role of this phosphoprotein in protecting TCM from apoptosis. Our results provide, for the first time in humans, an insight into molecular mechanisms that could be responsible for the longevity and persistence of CD4+ TCM.
Figures
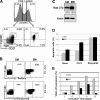
Figure 1.
Functional and phenotypical characterization of CD4+ TCM and TEM. (A) CD45RA, CD27, and CCR7 labeling profile and gating strategy for naive, TCM, and TEM. Percentages obtained for each population are indicated. The purity of sorted cells was consistently >95%. (B) Perforin and Gr-B expression in ex vivo TCM and TEM subsets. Perforin and Gr-B expression were assayed by intracellular staining. The percentages of TCM and TEM expressing perforin and Gr-B are indicated in each quadrant. SSC, side scatter. (C) Rab-27a protein levels in ex vivo sorted TCM and TEM subsets. Similar results were obtained in three independent experiments. (D) Susceptibility of TCM and TEM to Fas-induced apoptosis. TCM and TEM were sorted by flow cytometry and treated with 1.25 μg/ml of the anti-Fas antibody CH11 or 100 μg/ml etoposide for 24 h. The percentage of apoptotic cells was assessed by flow cytometry using Annexin V labeling. The results are depicted as a percentage of apoptotic cells ± SD of three independent experiments. (E) Proliferation and persistence of purified TCM and TEM. Sorted TCM and TEM were co-cultured with mDCs in the presence of superantigen (SEA) for 15 d. After 1–15 d, the proportion of proliferating cells was assessed by staining of anti-TCRVβ22, as Vβ22 is known to be a highly SEA-reactive Vβ. Results are represented as the percentage of Vβ22-positive cells.
Figure 2.
Gene expression array analysis of ex vivo CD4+ TCM and TEM. (A) PCA. TCM (blue) separate well from TEM (red) in this three-dimensional projection of the first three principal components. (B) Two-way hierarchical clustering of CD4+ TCM and TEM expression profiles. The far left column represents sample labels, with TCM donors shown as green squares, and TEM donors shown as orange squares. Each additional column represents a different gene; green indicates lower than median expression (down-regulation) and red indicates higher than median expression (up-regulation). The results of the two-dimensional hierarchical clustering of genes and samples (Pearson correlation similarity measure) are shown as horizontal and vertical dendrograms.
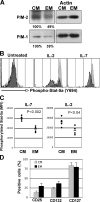
Figure 3.
STAT5a signaling pathway is functionally up-regulated in TCM. (A) PIM-1 and PIM-2 protein levels in ex vivo sorted TCM and TEM subsets. Similar results were obtained in three independent experiments. (B–D) PBMCs from healthy donors were treated with 100 U/ml IL-2 or 10 ng/ml IL-7 for 15 min at 37°C. Cells were labeled with antibodies to CD4, CD27, CCR7, CD45RA, and pSTAT5a. (B) Representative example of pSTAT5a expression levels. TCM-gated cells are represented in light gray, and TEM-gated cells are represented in dark gray. (C) Mean fluorescence intensity (MFI) of pSTAT5a level of expression measured in response to IL-2 or IL-7 in TCM and TEM (n = 4). Mean pSTAT5a signal values are represented by black bars. p-values (determined by the two-tailed t test) are shown. (D) Expression level of CD25, CD132, and CD127 in ex vivo TCM and TEM. PBMCs were labeled with antibodies to CD4, CD27, CCR7, and CD45RA to identify T cells subsets in conjunction with anti-CD127– or anti-CD25–specific antibodies. The results represent the proportions of CD127- and CD25-positive cells on TCM- and TEM-gated T cells (the percentage of positive cells ± SD of five experiments).
Figure 4.
Regulation of the FOXO3a pathway in memory CD4+ T cell subsets. (A) FOXO3a, pFOXO3a (S315, S253, or T32), Bim, p130, and Gadd45a protein levels in ex vivo sorted TCM and TEM. (B) Expression of FasL on activated TCM (gray) and TEM (black). PBMCs were activated with 10 ng/ml PMA and 500 ng/ml ionomycine for 24 h. Intracellular staining was performed using CD4, CD27, CD45RA, CCR7, and FasL antibodies. The percentages of FasL-positive cells for each subset are indicated. MFI measurements are in parentheses.
Figure 5.
AKT and IKK mediate FOXO3a phosphorylation and survival in CD4 T cells. (A) Regulation of FOXO3a phosphorylation. Purified CD4+ T cells were pretreated for 1 h with kinase inhibitors (10 μM AKT-VI, an AKT inhibitor; 5 μg/ml STO-609, a CamKK inhibitor; 100 μM wedelolactone, an IKK inhibitor; and 50 μM U0126, an MEK1/2 inhibitor). pFOXO3a (S253) was assessed. The results are representative of two independent experiments. (B) CD4+ T cell susceptibility to apoptosis induced upon treatment with specific kinase inhibitors. CD4+ T cells were cultured in the presence of kinase inhibitors for 24 h (100 μM U0126 and 10 μg/ml STO-609, and wedelolactone and AKT-IV as indicated). After 24 h, the proportion of Annexin V+, propidium iodide+ cells was quantified by flow cytometry. The results are depicted as a percentage of apoptotic cells within the total population and are representative of two independent experiments. (C) Bim expression levels in response to AKT and IKK inhibitors. CD4+ T cells were treated with 1.6 μM AKT-IV or 100 μM wedelolactone for 24 h. Cells were analyzed by Western blotting using Bim specific antibodies. (D and E) Regulation of AKT and IKK phosphorylation in CD4+ memory subsets. (D) pIKKαβ (S176/180) protein levels in ex vivo sorted TCM and TEM. Prolonged exposure did not reveal any pIKK signal in TEM. Similar results were obtained in three independent experiments. (E) PBMCs from healthy donors were treated with 5 mM H2O2 or 2 μg/ml Ig–cross-linked CD28 for 15 min at 37°C and labeled with CD4-, CD27-, CD45RA-, and pAKT (S473)-specific antibodies. The levels of pAKT were assessed by flow cytometry in TCM- and TEM-gated cell subsets. The results are represented as the mean fold increase ± SD of five independent experiments, calculated as follows: (MFI of stimulated cells/MFI of unstimulated cells). p-values (determined by the two-tailed t test) are shown.
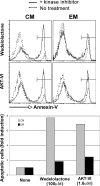
Figure 6.
Susceptibility of TCM and TEM to apoptosis induced by kinase inhibitors. Sorted TCM and TEM were cultured with or without AKT and IKK inhibitors as indicated. After 24 h, the percentage of apoptotic cells was quantified by Annexin V–FITC labeling. (top) Results from a representative individual. Histogram plots show the percentage of Annexin V+ cells in TCM and TEM after a 24-h exposure to AKT or IKK inhibitors. The dashed lines correspond to untreated cells, and the plain lines correspond to cells treated with kinase inhibitors. (bottom) Bar graph representation of the fold increase of apoptosis in TCM and TEM in response to IKK or AKT inhibitors. The fold increase of apoptosis is calculated as the percentage of apoptotic cells in treated cells divided by the percentage of apoptotic cells in untreated cells. Similar results were obtained in two independent experiments.
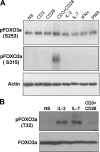
Figure 7.
FOXO3a phosphorylation is dependent on TCR and cytokine engagement. (A) CD4+ T cells were cultured in the presence of 2 μg/ml CD3, 2 μg/ml CD28, CD3 + CD28, 100 U/ml IL-2, 10 ng/ml IL-7, 50 μg/ml IFN-γ, or 50 ng/ml PMA for 15 min and analyzed by Western blotting for pFOXO3a (S315 and S253) expression levels. (B) CD4+ T cells were cultured in the presence of 100 U/ml IL-2, 10 ng/ml IL-7, or CD3 + CD28 for 30 min and analyzed by Western blotting for pFOXO3a (T32) expression levels. The results are representative of two independent experiments.
Similar articles
- IL-2 inhibited the generation of CD4+ memory T cells.
Lu H, Chen J, Nie X, Liu C, Sun W. Lu H, et al. Cell Biochem Biophys. 2014 Dec;70(3):1705-11. doi: 10.1007/s12013-014-0117-z. Cell Biochem Biophys. 2014. PMID: 24989679 - Transcription factor FOXO3a controls the persistence of memory CD4(+) T cells during HIV infection.
van Grevenynghe J, Procopio FA, He Z, Chomont N, Riou C, Zhang Y, Gimmig S, Boucher G, Wilkinson P, Shi Y, Yassine-Diab B, Said EA, Trautmann L, El Far M, Balderas RS, Boulassel MR, Routy JP, Haddad EK, Sekaly RP. van Grevenynghe J, et al. Nat Med. 2008 Mar;14(3):266-74. doi: 10.1038/nm1728. Epub 2008 Mar 2. Nat Med. 2008. PMID: 18311149 - Memories are made of this: synergy of T cell receptor and cytokine signals in CD4(+) central memory cell survival.
Caserta S, Zamoyska R. Caserta S, et al. Trends Immunol. 2007 Jun;28(6):245-8. doi: 10.1016/j.it.2007.04.006. Epub 2007 Apr 25. Trends Immunol. 2007. PMID: 17462952 Review. - Role of Forkhead box O3a transcription factor in autoimmune diseases.
Xu S, Ma Y, Chen Y, Pan F. Xu S, et al. Int Immunopharmacol. 2021 Mar;92:107338. doi: 10.1016/j.intimp.2020.107338. Epub 2021 Jan 4. Int Immunopharmacol. 2021. PMID: 33412391 Review.
Cited by
- Defining the molecular blueprint that drives CD8(+) T cell differentiation in response to infection.
Russ BE, Denton AE, Hatton L, Croom H, Olson MR, Turner SJ. Russ BE, et al. Front Immunol. 2012 Dec 19;3:371. doi: 10.3389/fimmu.2012.00371. eCollection 2012. Front Immunol. 2012. PMID: 23267358 Free PMC article. - Molecular and genetic inflammation networks in major human diseases.
Zhao Y, Forst CV, Sayegh CE, Wang IM, Yang X, Zhang B. Zhao Y, et al. Mol Biosyst. 2016 Jul 19;12(8):2318-41. doi: 10.1039/c6mb00240d. Mol Biosyst. 2016. PMID: 27303926 Free PMC article. Review. - Identification of Mycoplasma mycoides subsp. mycoides small colony genes coding for T-cell antigens.
Totté P, Mather A, Reslan L, Boublik Y, Niang M, Du Plessis D, Dedieu L. Totté P, et al. Clin Vaccine Immunol. 2010 Aug;17(8):1211-6. doi: 10.1128/CVI.00132-10. Epub 2010 Jun 9. Clin Vaccine Immunol. 2010. PMID: 20534794 Free PMC article. - The role of integration and clonal expansion in HIV infection: live long and prosper.
Anderson EM, Maldarelli F. Anderson EM, et al. Retrovirology. 2018 Oct 23;15(1):71. doi: 10.1186/s12977-018-0448-8. Retrovirology. 2018. PMID: 30352600 Free PMC article. Review. - Effect of the nonpeptide thrombopoietin receptor agonist Eltrombopag on bone marrow cells from patients with acute myeloid leukemia and myelodysplastic syndrome.
Will B, Kawahara M, Luciano JP, Bruns I, Parekh S, Erickson-Miller CL, Aivado MA, Verma A, Steidl U. Will B, et al. Blood. 2009 Oct 29;114(18):3899-908. doi: 10.1182/blood-2009-04-219493. Epub 2009 Aug 26. Blood. 2009. PMID: 19710504 Free PMC article.
References
- Kaech, S.M., E.J. Wherry, and R. Ahmed. 2002. Effector and memory T-cell differentiation: implications for vaccine development. Nat. Rev. Immunol. 2:251–262. - PubMed
- Sallusto, F., J. Geginat, and A. Lanzavecchia. 2004. Central memory and effector memory T cell subsets: function, generation, and maintenance. Annu. Rev. Immunol. 22:745–763. - PubMed
- Sallusto, F., D. Lenig, R. Forster, M. Lipp, and A. Lanzavecchia. 1999. Two subsets of memory T lymphocytes with distinct homing potentials and effector functions. Nature. 401:708–712. - PubMed
- Fritsch, R.D., X. Shen, G.P. Sims, K.S. Hathcock, R.J. Hodes, and P.E. Lipsky. 2005. Stepwise differentiation of CD4 memory T cells defined by expression of CCR7 and CD27. J. Immunol. 175:6489–6497. - PubMed
- Wu, C.Y., J.R. Kirman, M.J. Rotte, D.F. Davey, S.P. Perfetto, E.G. Rhee, B.L. Freidag, B.J. Hill, D.C. Douek, and R.A. Seder. 2002. Distinct lineages of T(H)1 cells have differential capacities for memory cell generation in vivo. Nat. Immunol. 3:852–858. - PubMed
Publication types
MeSH terms
Substances
LinkOut - more resources
Full Text Sources
Other Literature Sources
Molecular Biology Databases
Research Materials
Miscellaneous


