Neuromuscular development in the absence of programmed cell death: phenotypic alteration of motoneurons and muscle - PubMed (original) (raw)
Comparative Study
Neuromuscular development in the absence of programmed cell death: phenotypic alteration of motoneurons and muscle
Robert R Buss et al. J Neurosci. 2006.
Abstract
The widespread, massive loss of developing neurons in the central and peripheral nervous system of birds and mammals is generally considered to be an evolutionary adaptation. However, until recently, models for testing both the immediate and long-term consequences of preventing this normal cell loss have not been available. We have taken advantage of several methods for preventing neuronal death in vivo to ask whether rescued neurons [e.g., motoneurons (MNs)] differentiate normally and become functionally incorporated into the nervous system. Although many aspects of MN differentiation occurred normally after the prevention of cell death (including the expression of several motoneuron-specific markers, axon projections into the ventral root and peripheral nerves, ultrastructure, dendritic arborization, and afferent axosomatic synapses), other features of the neuromuscular system (MNs and muscle) were abnormal. The cell bodies and axons of MNs were smaller than normal, many MN axons failed to become myelinated or to form functional synaptic contacts with target muscles, and a subpopulation of rescued cells were transformed from alpha- to gamma-like MNs. Additionally, after the rescue of MNs in myogenin glial cell line-derived neurotrophic factor (MyoGDNF) transgenic mice, myofiber differentiation of extrafusal skeletal muscle was transformed and muscle physiology and motor behaviors were abnormal. In contrast, extrafusal myofiber phenotype, muscle physiology, and (except for muscle strength tests) motor behaviors were all normal after the rescue of MNs by genetic deletion of the proapoptotic gene Bax. However, there was an increase in intrafusal muscle fibers (spindles) in Bax knock-out versus both wild-type and MyoGDNF mice. Together, these data indicate that after the prevention of MN death, the neuromuscular system becomes transformed in novel ways to compensate for the presence of the thousands of excess cells.
Figures
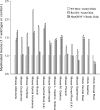
Figure 1.
Animals developing with reduced developmental PCD have more myelinated axons in peripheral and central nerves. With the exception of the Bax KO, all excess myelinated neurons are MNs (i.e., not sensory). The myelinated axon number has been normalized to WT (open bars), Bax KO and acutely paralyzed chick (single hatch), and MyoGDNF and chronically paralyzed chick ventral and dorsal root (cross hatch). The background mouse strain was C57BL6/J with the exception of MyoGDNF mice and the buccal nerve data, which was from an outbred B6/CBA × C57BL6/J line. *Significant difference (p < 0.05, t test) from wild-type or control. Means, SDs, and sample sizes are presented in Table 1.
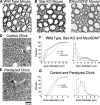
Figure 2.
Modification of MN axon size after rescue from PCD. A–E, Ventral root (L4) axons from WT (A), Bax KO (B), and MyoGDNF (C) mice (4–5 months old) maintained on a C57BL6/J background, and chick ventral roots from E17 control (D) and chronically paralyzed (E) White Leghorn chick embryos. F, G, Cumulative probability distributions and size histograms (normalized to WT axon number) of ventral root axon diameters from mice (F) and chick (G).
Figure 3.
Modification of lumbar MN soma size and growth after rescue from PCD. A, Normalized soma areas in E15, P0, P10, and adult mice and E17 chick. Soma size has been normalized to WT or control chick (open bars). B, Increase in mouse MN soma area between embryonic and postnatal stages. C, Cumulative probability distribution of mouse MN soma sizes. The background mouse strain was an outbred B6/CBA × C57BL6/J line. *Significant difference (p < 0.05, t test) from WT or control. Means and SDs for A and B are provided in Tables 2 and 3.
Figure 4.
Analysis of dendritic morphology in WT, Bax KO, and MyoGDNF mice. A, Relationship between lumbar MN soma size and number of primary dendrites. WT (black circles; solid line; correlation coefficient, r = 0.44), Bax KO (gray circles; dotted line; r = 0.73), and MyoGDNF (open diamonds; dashed black line; r = 0.29) are shown. B, Dendrite density in the lumbar ventral horn (arbitrary pixel values normalized to WT = 1; mean ± coefficient of variation). *Significant difference (p < 0.05, t test) from wild-type. Values in parentheses are numbers of animals. The background mouse strain was an outbred CBA × C57BL6/J line.
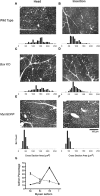
Figure 5.
A–F, Montages of cross sections of the medial gastrocnemius muscle at the head region (A, C, E), where a mixed fiber population resides in WT, and the insertion region (B, D, F), where a homogenous large fiber population resides in WT mice. Wild-type (A, B), Bax KO (C, D) and MyoGDNF (E, F) mice (1 month old) are shown. Note the increased capillaries in E and F. Histograms show muscle fiber cross-section area measurements (n = 3 animals, 50 myofibers per animal). G, The proportion of myosin heavy chain isoforms in the medial gastrocnemius of adult WT (solid line), Bax KO (dashed line), and MyoGDNF (dotted line) mice as determined by SDS-PAGE (see Materials and Methods). Error bars indicate SD.
Figure 6.
Behavioral tests of adult WT, Bax KO, and MyoGDNF mice. A, The duration and speed attained (mean ± SD) before falling off the rotorod. *p < 0.005 versus WT control (t test). B, The number (mean ± SD) of errors (see Materials and Methods) per minute in the hole board test. *p < 0.0005 versus WT control (t test). C, The proportion (percentage) of animals that successfully crossed the different size balance beams in a 2 min test. D, Grip strength in grams of force (mean ± SD). *p < 0.01, **p < 0.005 versus WT control (t tests). E, Duration in seconds (mean ± SD) before falling from the hanging wire. **p < 0.002 versus WT control (t test).
Figure 7.
Based on size and immunolabeling, the supernumerary myelinated MNs in Bax KO mice are γ-like MNs, whereas excess MyoGDNF MNs have properties intermediate to α- and γ-MNs. A–B, Supernumerary Bax KO muscle spindles are innervated and indistinguishable from WT. *Intrafusal myofibers; arrows, axons. C–F, Developmental time course of myelination. WT (solid black line), Bax KO (dashed black line), and MyoGDNF (dotted black line) are shown. *Bax KO and + MyoGDNF are significantly different from WT (p < 0.05, t test). Values shown are mean ± SD. G–I, A putative γ-MN marker (antibody to α3 subunit of the Na+/K+ ATPase) primarily labels small-diameter myelinated axons in the L4 VR.
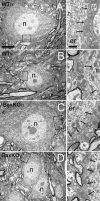
Figure 8.
Ultrastructure of WT and Bax KO α- and γ-sized MNs (soma area >400 μm2 and <400 μm2, respectively). Low-magnification electron micrographs show relative difference in size between α (A, C) and γ (B, C) MNs. No significant differences in synapse density were found between WT and Bax KO α- or γ-MNs, although γ-MNs had fewer synapses per unit cell surface than larger α-MNs. Boxed areas are enlarged at right to show synapse morphology; arrows point to synaptic densities with vesicles apparent on the postsynaptic elements. n, Nucleus; er, endoplasmic reticulum. Scale bars: (in A, left) A–D, left, 10 μm; (in A, right) A–D, right, 1 μm.
Figure 9.
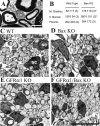
Motoneuron axons in the ventral roots and peripheral nerves. A, Many unmyelinated axons (asterisks) occur in the L4 ventral root of adult Bax KO mice. B, Increased numbers of unmyelinated axons in peripheral nerves of the adult Bax KO. C–F, Ventral root axons in P0 WT (C), Bax KO (D), GFRα1 KO (E), and GFRα1/Bax double mutants (F). Note the increase in small unmyelinated axons in F. Schwann cells (SC) are indicated C. In B, the asterisk indicates p < 0.05 versus WT(t tests) and the values are mean ± SD. Scale bars: A, 10 μm; (in F) C–F, 10 μm.
Similar articles
- Neuromuscular development after the prevention of naturally occurring neuronal death by Bax deletion.
Sun W, Gould TW, Vinsant S, Prevette D, Oppenheim RW. Sun W, et al. J Neurosci. 2003 Aug 13;23(19):7298-310. doi: 10.1523/JNEUROSCI.23-19-07298.2003. J Neurosci. 2003. PMID: 12917363 Free PMC article. - Gamma motor neurons express distinct genetic markers at birth and require muscle spindle-derived GDNF for postnatal survival.
Shneider NA, Brown MN, Smith CA, Pickel J, Alvarez FJ. Shneider NA, et al. Neural Dev. 2009 Dec 2;4:42. doi: 10.1186/1749-8104-4-42. Neural Dev. 2009. PMID: 19954518 Free PMC article. - Neuromuscular development in the avian paralytic mutant crooked neck dwarf (cn/cn): further evidence for the role of neuromuscular activity in motoneuron survival.
Oppenheim RW, Prevette D, Houenou LJ, Pincon-Raymond M, Dimitriadou V, Donevan A, O'Donovan M, Wenner P, Mckemy DD, Allen PD. Oppenheim RW, et al. J Comp Neurol. 1997 May 12;381(3):353-72. doi: 10.1002/(sici)1096-9861(19970512)381:3<353::aid-cne7>3.0.co;2-1. J Comp Neurol. 1997. PMID: 9133573 - Naturally occurring and axotomy-induced motoneuron death and its prevention by neurotrophic agents: a comparison between chick and mouse.
Houenou LJ, Li L, Lo AC, Yan Q, Oppenheim RW. Houenou LJ, et al. Prog Brain Res. 1994;102:217-26. doi: 10.1016/S0079-6123(08)60542-7. Prog Brain Res. 1994. PMID: 7800814 Review. - Dynamics of nerve-muscle interaction in developing and mature neuromuscular junctions.
Grinnell AD. Grinnell AD. Physiol Rev. 1995 Oct;75(4):789-834. doi: 10.1152/physrev.1995.75.4.789. Physiol Rev. 1995. PMID: 7480163 Review.
Cited by
- Effects of Bax gene deletion on social behaviors and neural response to olfactory cues in mice.
Holmes MM, Niel L, Anyan JJ, Griffith AT, Monks DA, Forger NG. Holmes MM, et al. Eur J Neurosci. 2011 Nov;34(9):1492-9. doi: 10.1111/j.1460-9568.2011.07881.x. Eur J Neurosci. 2011. PMID: 22034980 Free PMC article. - The neurotrophic effects of glial cell line-derived neurotrophic factor on spinal motoneurons are restricted to fusimotor subtypes.
Gould TW, Yonemura S, Oppenheim RW, Ohmori S, Enomoto H. Gould TW, et al. J Neurosci. 2008 Feb 27;28(9):2131-46. doi: 10.1523/JNEUROSCI.5185-07.2008. J Neurosci. 2008. PMID: 18305247 Free PMC article. - Mitochondrial quality control in the brain: The physiological and pathological roles.
Shen X, Sun P, Zhang H, Yang H. Shen X, et al. Front Neurosci. 2022 Dec 12;16:1075141. doi: 10.3389/fnins.2022.1075141. eCollection 2022. Front Neurosci. 2022. PMID: 36578825 Free PMC article. Review. - Neuronal Cell Death.
Fricker M, Tolkovsky AM, Borutaite V, Coleman M, Brown GC. Fricker M, et al. Physiol Rev. 2018 Apr 1;98(2):813-880. doi: 10.1152/physrev.00011.2017. Physiol Rev. 2018. PMID: 29488822 Free PMC article. Review. - How to Build and to Protect the Neuromuscular Junction: The Role of the Glial Cell Line-Derived Neurotrophic Factor.
Stanga S, Boido M, Kienlen-Campard P. Stanga S, et al. Int J Mol Sci. 2020 Dec 24;22(1):136. doi: 10.3390/ijms22010136. Int J Mol Sci. 2020. PMID: 33374485 Free PMC article. Review.
References
- Burke RE. Handbook of physiology, Vol 2, The nervous system, motor control. Bethesda: American Physiological Society; 1981. Motor units: anatomy, physiology, and functional organization; pp. 345–422.
- Buss RR, Sun W, Oppenheim RW. Adaptive roles of programmed cell death during nervous system development. Annual Rev Neurosci. 2006;29:1–35. - PubMed
- Clarke PG, Oppenheim RW. Neuron death in vertebrate development: in vivo methods. Methods Cell Biol. 1995;46:277–321. - PubMed
Publication types
MeSH terms
Substances
LinkOut - more resources
Full Text Sources
Molecular Biology Databases
Research Materials
