Alphav beta6 integrin regulates renal fibrosis and inflammation in Alport mouse - PubMed (original) (raw)
. 2007 Jan;170(1):110-25.
doi: 10.2353/ajpath.2007.060158.
Matvey E Lukashev, Yi Luo, William J Yang, Brian M Dolinski, Paul H Weinreb, Kenneth J Simon, Li Chun Wang, Diane R Leone, Roy R Lobb, Donald J McCrann, Normand E Allaire, Gerald S Horan, Agnes Fogo, Raghu Kalluri, Charles F Shield 3rd, Dean Sheppard, Humphrey A Gardner, Shelia M Violette
Affiliations
- PMID: 17200187
- PMCID: PMC1762706
- DOI: 10.2353/ajpath.2007.060158
Alphav beta6 integrin regulates renal fibrosis and inflammation in Alport mouse
Kyungmin Hahm et al. Am J Pathol. 2007 Jan.
Abstract
The transforming growth factor (TGF)-beta-inducible integrin alpha v beta6 is preferentially expressed at sites of epithelial remodeling and has been shown to bind and activate latent precursor TGF-beta. Herein, we show that alpha v beta6 is overexpressed in human kidney epithelium in membranous glomerulonephritis, diabetes mellitus, IgA nephropathy, Goodpasture's syndrome, and Alport syndrome renal epithelium. To assess the potential regulatory role of alpha v beta6 in renal disease, we studied the effects of function-blocking alpha v beta6 monoclonal antibodies (mAbs) and genetic ablation of the beta6 subunit on kidney fibrosis in Col4A3-/- mice, a mouse model of Alport syndrome. Expression of alpha v beta6 in Alport mouse kidneys was observed primarily in cortical tubular epithelial cells and in correlation with the progression of fibrosis. Treatment with alpha v beta6-blocking mAbs inhibited accumulation of activated fibroblasts and deposition of interstitial collagen matrix. Similar inhibition of renal fibrosis was observed in beta6-deficient Alport mice. Transcript profiling of kidney tissues showed that alpha v beta6-blocking mAbs significantly inhibited disease-associated changes in expression of fibrotic and inflammatory mediators. Similar patterns of transcript modulation were produced with recombinant soluble TGF-beta RII treatment, suggesting shared regulatory functions of alpha v beta6 and TGF-beta. These findings demonstrate that alpha v beta6 can contribute to the regulation of renal fibrosis and suggest this integrin as a potential therapeutic target.
Figures
Figure 1
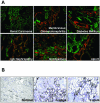
αvβ6 immunostaining in human kidney disease. A: Frozen human kidney sections immunostained with an αvβ6 mAb (red) and a pan-cytokeratin mAb (green). All images were taken at the same magnification. B: Paraffin-embedded human kidney sections immunostained with an αvβ6 mAb.
Figure 2
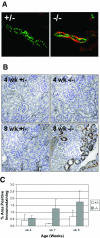
αvβ6 immunostaining in Col4A3+/− and Col4A3−/− mouse kidneys. A: Frozen kidney sections from 7-week-old Col4A3+/− mice and Col4A3−/− mice immunostained with an αvβ6 mAb (red) and a pan-cyto-keratin mAb (green). B: Paraffin-embedded kidney sections from 4- and 8-week-old Col4A3+/− and Col4A3−/− mice immunostained with an αvβ6 mAb. C: Quantitation of αvβ6 immunostaining in kidneys from 4-, 7-, and 8-week-old Col4A3+/− and Col4A3−/− mice (n = 3).
Figure 3
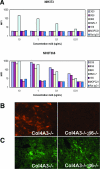
Specificity of αvβ6 mAb binding. A: Flow cytometry analysis of αvβ6 mAbs (3G9, 8G6, and 8B3), anti-αv mAb (RMV-7), negative control mAbs (1E6 and MOPC21), and isotype control (rat IgG1) binding to NIH3T3 cells and NIH3T3b6 cells. B: Immunostaining Col4A3−/− and Col4A3−/−;β6−/− kidney sections with anti-αvβ6 mAb (human/mouse chimeric 3G9). C: Immunostaining Col4A3−/− and Col4A3−/−;β6−/− kidney sections with anti-αv polyclonal antibody.
Figure 4
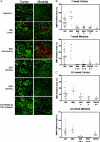
Immunostaining SMA in Col4A3+/− or Col4A3−/− mouse kidneys after various treatments. A: Immunostaining SMA (red) and laminin (green) in kidneys is shown for Col4A3−/− mice treated from 3 to 8.5 weeks of age and untreated age-matched Col4A3+/− mice. Immunostaining (cortex and medulla) of a representative section for each treatment group is shown (n = 8 per group). B and C: Quantitation of SMA staining in kidneys of untreated Col4A3+/− mice and Col4A3−/− mice treated with various agents from 3 to 7 weeks of age or from 3 to 8.5 weeks of age. Percent positive immunostaining for cortex and medulla relative to total image size is shown. N value for each treatment group designated in scatter-plot. *P < 0.01, **P < 0.05, ***P < 0.001 comparing treatment groups with negative control mAb 1E6-treated mice.
Figure 5
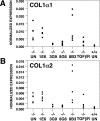
Taqman analysis of collagen 1α1 (A) and collagen 1α2 (B) mRNA levels. RNA was isolated from kidneys of 7-week-old untreated or treated Col4A3−/− mice and 7-week-old untreated Col4A3+/+ mice.
Figure 6
Quantitation of SMA immunostaining and healthy tubule area in kidneys from Col4A3−/− kidneys with delayed 3G9 mAb treatment. A: SMA immunostaining in kidneys from untreated 8.5-week-old Col4A3+/− mice, untreated 6-week-old Col4A3−/− mice, untreated 8.5-week-old Col4A3−/− mice, and 8.5-week-old Col4A3−/− mice treated with 1E6 and 3G9 from 6 to 8.5 weeks of age were quantitated. N value for each treatment group designated in scatter plot. *P < 0.0005, comparing 3G9 treatment group with negative control mAb 1E6-treated Col4A3−/− mice. **P < 0.02 comparing 3G9 treatment group with untreated 6-week-old Col4A3−/− mice. B: Quantitation of area of healthy tubules (healthy tubule volume index), area of degenerated tubules and interstitial space (interstitial volume index), and number of dilated tubules (tubular dilation index). *P < 0.001, and **P < 0.002 comparing 3G9 treated with negative control mAb 1E6-treated Col4A3−/− mice.
Figure 7
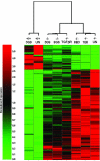
Patterns of gene expression and modulation in kidneys of 7-week-old Col4A3−/− mice. Shown are 395 GeneChip probe sets selected for twofold or greater variation between wild-type and untreated Col4A3−/− (UN) groups at P < 0.01. The columns of the heat map display patterns of relative gene expression levels for individual experimental groups. Each column represents 395 normalized mean probe set signal intensity values for a single experimental group of five mice. Changes in gene expression across the experimental conditions are reflected in the color variation as shown by the color bar. Two-dimensional hierarchical clustering was performed to explore relationships (shown by the dendrogram) among the experimental groups.
Figure 8
Functional annotation of αvβ6-dependent genes associated with renal disease in Col4A3−/− kidneys. IPA was performed separately on the lists of probe sets corresponding to genes over- or underexpressed in Col4A3−/− kidneys compared with wild type. The lists used for IPA were subsets of the 395 probe sets originally selected for significant (>2-fold, P < 0.01) variation between Col4A3−/− and wild-type groups. Shown are rank-ordered lists of biological functions (A and C) and canonical pathways (B and D) associated with genes overexpressed (A and B) and down-modulated (C and D) in 7-week-old Col4A3−/− kidneys.
Figure 9
Subset and network analysis of genes differentially expressed in Col4A3−/− kidneys and modulated by blocking αvβ6 mAb treatment. A: Venn diagram of the probe set lists. The areas of the Venn circles, their unions, and intersections are proportional to the numbers probe sets in the corresponding lists. B and C: Highest scoring regulatory networks inferred from the lists of probe sets significantly (>2-fold variation between treated and naive Alport kidneys, P < 0.05) affected by the αvβ6-blocking mAbs 3G9 (B) and 8G6 (C). Edges of the networks show directions of interactions among the genes depicted as the nodes and arranged according to their cellular localization. Shaded symbols represent genes affected by the blockade of αvβ6 function. Their inferred network neighbors are shown as open symbols.
Figure 10
Immunohistochemical and Taqman analysis of TGF-β1 expression. A: Kidney sections from Col4A3+/− and Col4A3−/− mice treated with indicated agents were immunostained for TGF-β1 expression. Staining is shown for a representative section from each treatment group. B: Taqman analysis of TGF-β1 mRNA levels in various treatment groups.
Figure 11
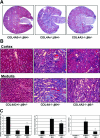
Trichrome staining for collagen expression in kidneys and quantitation of healthy tubule area. Whole kidney sections (A) and kidney sections (B) shown at ×20 for 10-week-old Col4A3+/−;β6+/−, Col4A3−/−;β6+/−, and Col4A3−/−;β6−/− mice. Representative sections are shown for cortex and medullary regions of the kidneys. C: Quantitation of area of healthy tubules (healthy tubule volume index), area of degenerated tubules and interstitial space (interstitial volume index), and number of dilated tubules (tubular dilation index). *P < 0.001 comparing Col4A3−/−;β6−/− with Col4A3−/−;β6+/− mice.
Similar articles
- Partial inhibition of integrin alpha(v)beta6 prevents pulmonary fibrosis without exacerbating inflammation.
Horan GS, Wood S, Ona V, Li DJ, Lukashev ME, Weinreb PH, Simon KJ, Hahm K, Allaire NE, Rinaldi NJ, Goyal J, Feghali-Bostwick CA, Matteson EL, O'Hara C, Lafyatis R, Davis GS, Huang X, Sheppard D, Violette SM. Horan GS, et al. Am J Respir Crit Care Med. 2008 Jan 1;177(1):56-65. doi: 10.1164/rccm.200706-805OC. Epub 2007 Oct 4. Am J Respir Crit Care Med. 2008. PMID: 17916809 - Inhibition of integrin alpha(v)beta6, an activator of latent transforming growth factor-beta, prevents radiation-induced lung fibrosis.
Puthawala K, Hadjiangelis N, Jacoby SC, Bayongan E, Zhao Z, Yang Z, Devitt ML, Horan GS, Weinreb PH, Lukashev ME, Violette SM, Grant KS, Colarossi C, Formenti SC, Munger JS. Puthawala K, et al. Am J Respir Crit Care Med. 2008 Jan 1;177(1):82-90. doi: 10.1164/rccm.200706-806OC. Epub 2007 Oct 4. Am J Respir Crit Care Med. 2008. PMID: 17916808 Free PMC article. - Preemptive ramipril therapy delays renal failure and reduces renal fibrosis in COL4A3-knockout mice with Alport syndrome.
Gross O, Beirowski B, Koepke ML, Kuck J, Reiner M, Addicks K, Smyth N, Schulze-Lohoff E, Weber M. Gross O, et al. Kidney Int. 2003 Feb;63(2):438-46. doi: 10.1046/j.1523-1755.2003.00779.x. Kidney Int. 2003. PMID: 12631109 - Epithelial-mesenchymal interactions in fibrosis and repair. Transforming growth factor-β activation by epithelial cells and fibroblasts.
Sheppard D. Sheppard D. Ann Am Thorac Soc. 2015 Mar;12 Suppl 1(Suppl 1):S21-3. doi: 10.1513/AnnalsATS.201406-245MG. Ann Am Thorac Soc. 2015. PMID: 25830829 Free PMC article. Review. - Progressive renal disease: fibroblasts, extracellular matrix, and integrins.
Norman JT, Fine LG. Norman JT, et al. Exp Nephrol. 1999 Mar-Apr;7(2):167-77. doi: 10.1159/000020597. Exp Nephrol. 1999. PMID: 10213870 Review.
Cited by
- Degradation of internalized αvβ5 integrin is controlled by uPAR bound uPA: effect on β1 integrin activity and α-SMA stress fiber assembly.
Wang L, Pedroja BS, Meyers EE, Garcia AL, Twining SS, Bernstein AM. Wang L, et al. PLoS One. 2012;7(3):e33915. doi: 10.1371/journal.pone.0033915. Epub 2012 Mar 21. PLoS One. 2012. PMID: 22470492 Free PMC article. - The ITGB6 gene: its role in experimental and clinical biology.
Meecham A, Marshall JF. Meecham A, et al. Gene X. 2019 Nov 6;5:100023. doi: 10.1016/j.gene.2019.100023. eCollection 2020 Dec. Gene X. 2019. PMID: 32550552 Free PMC article. Review. - Glomerular endothelial cell heterogeneity in Alport syndrome.
Soloyan H, Thornton M, Villani V, Khatchadourian P, Cravedi P, Angeletti A, Grubbs B, De Filippo R, Perin L, Sedrakyan S. Soloyan H, et al. Sci Rep. 2020 Jul 10;10(1):11414. doi: 10.1038/s41598-020-67588-0. Sci Rep. 2020. PMID: 32651395 Free PMC article. - The role of cell-extracellular matrix interactions in glomerular injury.
Borza CM, Pozzi A. Borza CM, et al. Exp Cell Res. 2012 May 15;318(9):1001-10. doi: 10.1016/j.yexcr.2012.02.033. Epub 2012 Mar 5. Exp Cell Res. 2012. PMID: 22417893 Free PMC article. Review. - Shared and distinct mechanisms of fibrosis.
Distler JHW, Györfi AH, Ramanujam M, Whitfield ML, Königshoff M, Lafyatis R. Distler JHW, et al. Nat Rev Rheumatol. 2019 Dec;15(12):705-730. doi: 10.1038/s41584-019-0322-7. Epub 2019 Nov 11. Nat Rev Rheumatol. 2019. PMID: 31712723 Review.
References
- Okada H, Kalluri R. Cellular and molecular pathways that lead to progression and regression of renal fibrogenesis. Curr Mol Med. 2005;5:467–474. - PubMed
- Sheppard D. Functions of pulmonary epithelial integrins: from development to disease. Physiol Rev. 2003;83:673–686. - PubMed
- Norman JT, Fine LG. Progressive renal disease: fibroblasts, extracellular matrix, and integrins. Exp Nephrol. 1999;7:167–177. - PubMed
- Border WA, Noble NA. Interactions of transforming growth factor-beta and angiotensin II in renal fibrosis. Hypertension. 1998;31:181–188. - PubMed
- Wang W, Koka V, Lan HY. Transforming growth factor-beta and Smad signalling in kidney diseases. Nephrology. 2005;10:48–56. - PubMed
Publication types
MeSH terms
Substances
LinkOut - more resources
Full Text Sources
Other Literature Sources
Molecular Biology Databases
Miscellaneous
