Histone acetyltransferase p300 modulates gene expression in an epigenetic manner at high blood alcohol levels - PubMed (original) (raw)
Histone acetyltransferase p300 modulates gene expression in an epigenetic manner at high blood alcohol levels
Fawzia Bardag-Gorce et al. Exp Mol Pathol. 2007 Apr.
Abstract
When rats are fed ethanol intragastrically at a constant rate for 1 month, the urinary alcohol level (UAL) cycles over 7-9 day intervals. At the peak UAL, the liver is hypoxic shifting the redox state to a reduced rate. Microarray analysis done on livers at the UAL peaks shows changes in approximately 1300 gene expression compared to the pair-fed controls. To determine the mechanism of the gene expression changes, histone acetylation regulation was investigated in liver nuclear extracts at the peaks and troughs of the UAL and their pair-fed controls. No change occurred in SirT-1. P300, a histone acetyltransferase (HAT), which acetylates histone H3 on lysine 9, was increased at the peaks. Histone 3 acetylated at lysine 9 was also increased at the peaks. This indicates that the up regulated genes at the UAL peaks resulted from an increase in p300 transcription regulation, epigenetically. P300 activates transcription of numerous genes in response to signal transcription factors such as H1F 1alpha, increased in the nucleus at UAL peaks. Signal transduction pathways, such as NFkappaB, AP-1, ERK, JNK, and p38 were not increased at the peaks. beta-Catenin was increased in the nuclear extract at the UAL troughs, where increased gene expression was absent. The increase in gene expression at the peaks was due, in part, to increased acetylation of histone 3 at lysine 9.
Figures
Fig 1
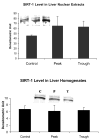
There was no change in SirT1 in the nuclear extracts or the whole homogenates in either the peaks or troughs of the UAL cycle (mean ± SEM, n = 3, p = 0.53 in the nuclear extract).
Fig 2
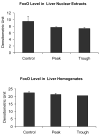
There was no change in FoxO1 in the liver homogenates or nuclear extracts at the peaks and troughs of the UAL cycle (mean ± SEM, n = 3, p = 0.22 in the nuclear extract).
Fig 3
There was an increase in histone 3 lysine 9 acetylation in the nuclear extracts at the UAL peaks (mean ± SEM), (P vs C : p=0.02; P vs T : p=0.027; n=3).
Fig 4
There was an increase in p300 levels in the nuclear extracts at the peaks of the UAL (mean ± SEM, P vs C : p=0.015; P vs T : p=0.019; ; n = 3).
Fig 5
There was no change in CBP levels in the nuclear extracts at the peaks and troughs of the UAL cycle. (mean ± SEM, n = 3).
Fig 6
There was no change in NFκB p65 levels in the nuclear extracts at the peaks and troughs of the UAL cycle (mean ± SEM, n = 3).
Fig 7
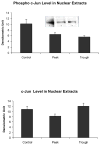
Phospho-c-Jun tended to decrease in the nuclear extracts at the peaks of the UAL cycle (C vs T p = 0.056, C vs P = 0.11, mean ± SEM, n = 3). However there was n o change in c-Jun itself.
Fig. 8
The level of phospho-Akt Th308 in the nuclear extracts was decreased at the trough compared to the controls (C vs T p = 0.013, mean ± SEM, n = 3).
Fig. 9
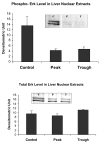
The levels of phospho ERK1/phosphoERK2 in the liver in the nuclear extracts were decreased at the peaks of the UAL (C vs P p= 0.04 C vs T p= 0.022, mean ± SEM, n=3).
Fig 10
The levels of p38 MAPK were decreased in the nuclear extracts at the peaks and troughs of the UAL cycle (mean ± SEM, n = 3), p<0.02 P vs C, p<0.047 vs C).
Fig. 11
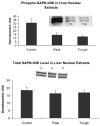
The levels of phospho-JNK was decreased in the nuclear extracts at both the peaks and troughs of the UAL cycle (C vs P p= 0.031 C vs T p=0.040, mean ± SEM, n = 3).
Fig 12
The level of β-catenin was increased in the nuclear extracts at both the peaks and troughs of the UAL cycle (C vs T p=0.013, C vs P p=0.006, mean ± SEM, n = 3).
Similar articles
- Involvement of histone acetyltransferase (HAT) in ethanol-induced acetylation of histone H3 in hepatocytes: potential mechanism for gene expression.
Park PH, Lim RW, Shukla SD. Park PH, et al. Am J Physiol Gastrointest Liver Physiol. 2005 Dec;289(6):G1124-36. doi: 10.1152/ajpgi.00091.2005. Epub 2005 Aug 4. Am J Physiol Gastrointest Liver Physiol. 2005. PMID: 16081763 - Histone acetyltransferase p300 regulates the transcription of human erythroid-specific 5-aminolevulinate synthase gene.
Han L, Lu J, Pan L, Wang X, Shao Y, Han S, Huang B. Han L, et al. Biochem Biophys Res Commun. 2006 Sep 29;348(3):799-806. doi: 10.1016/j.bbrc.2006.07.147. Epub 2006 Aug 1. Biochem Biophys Res Commun. 2006. PMID: 16904069 - Activation of p300 histone acetyltransferase activity and acetylation of the androgen receptor by bombesin in prostate cancer cells.
Gong J, Zhu J, Goodman OB Jr, Pestell RG, Schlegel PN, Nanus DM, Shen R. Gong J, et al. Oncogene. 2006 Mar 30;25(14):2011-21. doi: 10.1038/sj.onc.1209231. Oncogene. 2006. PMID: 16434977 - The pathogenesis and significance of the urinary alcohol cycle in rats fed ethanol intragastrically.
French SW. French SW. Alcohol Clin Exp Res. 2005 Nov;29(11 Suppl):158S-161S. Alcohol Clin Exp Res. 2005. PMID: 16344601 Review. - The multifaceted role of lysine acetylation in cancer: prognostic biomarker and therapeutic target.
Di Martile M, Del Bufalo D, Trisciuoglio D. Di Martile M, et al. Oncotarget. 2016 Aug 23;7(34):55789-55810. doi: 10.18632/oncotarget.10048. Oncotarget. 2016. PMID: 27322556 Free PMC article. Review.
Cited by
- Gene-selective histone H3 acetylation in the absence of increase in global histone acetylation in liver of rats chronically fed alcohol.
Park PH, Lim RW, Shukla SD. Park PH, et al. Alcohol Alcohol. 2012 May-Jun;47(3):233-9. doi: 10.1093/alcalc/ags004. Epub 2012 Feb 2. Alcohol Alcohol. 2012. PMID: 22301686 Free PMC article. - The cyclic pattern of blood alcohol levels during continuous ethanol feeding in rats: the effect of feeding S-adenosylmethionine.
Bardag-Gorce F, Li J, Oliva J, Lu SC, French BA, French SW. Bardag-Gorce F, et al. Exp Mol Pathol. 2010 Jun;88(3):380-7. doi: 10.1016/j.yexmp.2010.03.004. Epub 2010 Mar 17. Exp Mol Pathol. 2010. PMID: 20303346 Free PMC article. - Decoding the epigenetic language of neuronal plasticity.
Borrelli E, Nestler EJ, Allis CD, Sassone-Corsi P. Borrelli E, et al. Neuron. 2008 Dec 26;60(6):961-74. doi: 10.1016/j.neuron.2008.10.012. Neuron. 2008. PMID: 19109904 Free PMC article. Review. - p300 exerts an epigenetic role in chronic neuropathic pain through its acetyltransferase activity in rats following chronic constriction injury (CCI).
Zhu XY, Huang CS, Li Q, Chang RM, Song ZB, Zou WY, Guo QL. Zhu XY, et al. Mol Pain. 2012 Nov 23;8:84. doi: 10.1186/1744-8069-8-84. Mol Pain. 2012. PMID: 23176208 Free PMC article. - Epigenetics of alcohol-related liver diseases.
Habash NW, Sehrawat TS, Shah VH, Cao S. Habash NW, et al. JHEP Rep. 2022 Mar 10;4(5):100466. doi: 10.1016/j.jhepr.2022.100466. eCollection 2022 May. JHEP Rep. 2022. PMID: 35462859 Free PMC article. Review.
References
- Bardag-Gorce F, French BA, Li J, French SW. The blood alcohol level affects genes expression and transcription regulator proteins in an epigenetic manner. Hepatology. 2006:Abstract 1084.
- Bardag-Gorce F, French BA, Dedes J, Li J, French SW. Gene expression patterns of the liver in response to alcohol: In vitro and in vivo models compared. Exp Mol Pathol. 2006;80:241–251. - PubMed
- Bardag-Gorce F, French BA, Li J, Riley NE, Yuan QX, Reitz NE, Yuan QX, Reitz R, Cai Y, Wan Y-JY, French SW. The importance of cycling of blood alcohol levels in the pathogenesis of experimental alcoholic liver disease in rats fed ethanol intragastrically. Gastroenterology. 2002;13:325–35. - PubMed
- Bradford MM. A rapid and sensitive method for the quantitation of microgram quantities protein utilizing the principle of protein-dye binding. Anal Biochem. 1976;72:248–254. - PubMed
- French BA, Dedes J, Bardag-Gorce F, Li J, Wilson L, Fu P, Nan L, French SW. Microarray analysis of gene expression in the liver during the urinary ethanol cycle in rats fed ethanol intragastrically at a constant rate. Exp Mol Pathol. 2005;79:87–94. - PubMed
Publication types
MeSH terms
Substances
LinkOut - more resources
Full Text Sources
Molecular Biology Databases
Research Materials
Miscellaneous
