The SCL transcriptional network and BMP signaling pathway interact to regulate RUNX1 activity - PubMed (original) (raw)
The SCL transcriptional network and BMP signaling pathway interact to regulate RUNX1 activity
John E Pimanda et al. Proc Natl Acad Sci U S A. 2007.
Abstract
Hematopoietic stem cell (HSC) development is regulated by several signaling pathways and a number of key transcription factors, which include Scl/Tal1, Runx1, and members of the Smad family. However, it remains unclear how these various determinants interact. Using a genome-wide computational screen based on the well characterized Scl +19 HSC enhancer, we have identified a related Smad6 enhancer that also targets expression to blood and endothelial cells in transgenic mice. Smad6, Bmp4, and Runx1 transcripts are concentrated along the ventral aspect of the E10.5 dorsal aorta in the aorta-gonad-mesonephros region from which HSCs originate. Moreover, Smad6, an inhibitor of Bmp4 signaling, binds and inhibits Runx1 activity, whereas Smad1, a positive mediator of Bmp4 signaling, transactivates the Runx1 promoter. Taken together, our results integrate three key determinants of HSC development; the Scl transcriptional network, Runx1 activity, and the Bmp4/Smad signaling pathway.
Conflict of interest statement
The authors declare no conflict of interest.
Figures
Fig. 1.
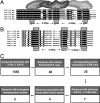
In silico identification of candidate cis-regulatory modules controlling blood and endothelial development. (A) Schematic diagram of a five-way sequence alignment of the SCL + 19 E/E/G (E/E/G) binding site cluster bound by a trimeric protein complex. The binding site consensus sequence, ggaw*6–26bp*ggaw*6–26bp*gata was used as a template for the initial genome-wide computational screen for conserved E/E/G motifs. Hs, human; Cf, dog; Mm, mouse; Rn, rat; Md, opossum. (B) The hematopoietic enhancer elements, FLI1 +12 and PRH +1 were identified by using the SCL + 19 enhancer template in A. These elements share the extended binding-site consensus sequence, aggaw*5–30bp*rggaw*5–30bp*wgata. (C) Stepwise filtering of candidate cis-regulatory modules.
Fig. 2.
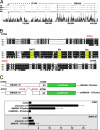
The SMAD6 E/E/G cluster is located within a highly conserved region 57 kb upstream of exon 1 and is required for its activity in cell lines. (A) Mammalian SMAD6 loci aligned by using multilagan with sequences from Hs, human; Mm, mouse; Rn, rat; and Md, opossum. Shown are coding exons (red rectangles), untranslated regions (beige), and repetitive elements (blue). The base pair numbering includes gaps introduced by the alignment program. The asterisk marks the E/E/G homology peak, located ≈57 kb upstream of exon 1 of human SMAD6. (B) Nucleotide sequence alignment of the −57 homology peak, with the conserved E/E/G binding sites shaded in yellow. Base pair numbering is from exon 1 of hSMAD6. (C) A 488-bp fragment of human DNA incorporating the SMAD6 −57 homology peak was subcloned into a SV/luciferase reporter vector (SMAD6 −57/SV/luc) and tested for enhancer activity along with a deletion (−57516 to −57433) mutant lacking the E/E/G cluster (m_SMAD6_ −57/SV/luc) and the Scl +19 stem cell enhancer (SV/luc/Scl +19).
Fig. 3.
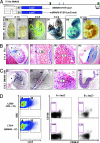
The E/E/G cluster in the SMAD6 −57 enhancer directs reporter activity to blood, blood vessels, heart, and brain. (Ai) Schematic diagram of the human SMAD6 locus. A fragment of DNA corresponding to the SMAD6 −57 region and a deletion mutant lacking the E/E/G motif were subcloned into the SV/LacZ reporter vector and used to generate transgenic mice. (Aii_–_Avii) E7.5-E11.5 X-Gal-stained whole-mount embryos from a SMAD6 −57/SV/LacZ transgenic line (7814) (Aii) E7.5 transgenic embryo showing staining within the primitive streak (arrow). (Aiii) E7.5 WT embryo with no staining. (Aiv) E8.5 transgenic embryo showing staining of the primitive heart (boxed). (Av) E9.5 transgenic embryo showing staining of the cardiac chambers (boxed) and blood vessels (arrows). (Avi) E11.5 transgenic embryo showing widespread endothelial/hematopoietic staining resulting in a generalized blue color. (Avii) E11.5 mutant transgenic embryo appears pale by contrast, owing to a lack of endothelial/hematopoietic staining. (Bi_–_Biv) Histological sections of a E11.5 X-Gal-stained transgenic embryo. (Bi) Heart, showing staining of the endocardium and endocardial cushions (arrow). (Bii) Dorsal aorta, showing staining of the endothelium (arrow). (Biii) Fetal liver, showing staining of blood (round) and endothelial (flat) cells. (Biv) Brain, showing staining of blood vessels (arrow) and brain (arrowhead). (Ci_–_Civ) ISH for Smad6 RNA expression in E12.5 embryos. (Ci) Heart, showing Smad6 expression in the cardiac cushions (arrow) and the endocardium (arrowhead). (Cii) Dorsal aorta, showing Smad6 expression in the aortic wall (arrow). (Ciii) Fetal liver, showing Smad6-positive cells scattered through the parenchyma. (Civ) Smad6 expression in the brain (arrowhead) and surrounding blood vessels (arrow). (D) Flow cytometry of bone marrow from Scl 6E5/lacZ/3′enh (L2269) and SMAD6 −57/SV/LacZ (L7814) transgenic mice. The Scl +19 and SMAD6 −57 transgenes target LacZ expression to a similar proportion of bone marrow cells. The LacZ-positive cells in L7814 (box B) express ≈4-fold more Smad6 by quantitative RT-PCR than LacZ-negative cells (box A). Cells targeted by the Scl +19 and _SMAD_6 −57 transgenes (box B) are enriched in CD150+/48−/41− (1:2.2 = HSC) cells and are relatively deficient in CD150−/48−/41− (lineage committed nonproliferating) cells. a, atrium; da, dorsal aorta; fl, fetal liver; h, heart; isv, intersomitic vessel; n, neural; s, somite; v, ventricle.
Fig. 4.
The Smad6 −57 enhancer in 416B cells is bound in vivo by Fli-1, Elf, Erg, and GATA2. (A) RT-PCR expression profile of selected ETS and GATA transcription factors in 416B hematopoietic cells and NIH 3T3 fibroblasts. Erg is not expressed in NIH 3T3 fibroblasts. (B) ChIP assays were performed on 416B hematopoietic progenitors (filled bars) and NIH 3T3 fibroblasts (open bars) and analyzed by real-time PCR. The levels of enrichment at Smad6 −57 (filled bars with asterisk) and flanking regions Smad6 −58 and −56 (filled bars without asterisk) were normalized to control IgG and plotted as fold increase over enrichments at a control region.
Fig. 5.
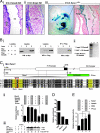
Integration of Bmp4, Smad6, and Runx1 activity. (A) Bmp4 and Smad6 expression in the dorsal aorta at E10.5 matches the expression of Runx1. (Ai) ISH for Bmp4 RNA. Dorsal aorta of a E10.5 embryo, showing subendothelial expression of Bmp4 concentrated along the ventral aspect (arrow) in the AGM. (Aii) ISH for Smad6 RNA, showing endothelial and subendothelial expression of Smad6 concentrated along the ventral floor of the dorsal aorta. (Aiii) A whole-mount X-Gal-stained and cleared, E10.5 Runx1_LZ_/+ embryo, showing prominent LacZ expression in the fetal liver (fl) and dorsal aorta (da) in the AGM. Higher magnification of Inset, showing prominent LacZ expression along the ventral surface of the dorsal aorta (arrow). (B) Smad6 forms a stable protein complex with Runx1. (Bi) Cos-7 cells were transfected with Flag-Smad6 and Myc-Runx1 expression plasmids. Cell lysates were immunoprecipitated (IP) with a mouse anti-Flag antibody and resolved by Western blot by using a rabbit anti-Myc antibody. Runx1 coprecipitated with Smad6 (see IP: α-Flag, lane 3). (Bii) _In vitro_-translated Smad6 (lane 1, input) was bound specifically by GST–Runx1 (lane 3) but not GST alone (lane 2) in pull-down experiments. (C) Smad6 mediates a reduction in Runx1 levels. (Ci) Runx1 transcripts originate from alternate promoters (P1 and P2). The P1 promoter has several conserved Runx- and Smad-binding sites. Three Runx-binding sites (yellow) and a Smad box are present within an ≈120-bp region. Hs, human; Cf, dog; Mm, mouse; Md, opossum; Xt, frog (Cii) A fragment of the P1 promoter was subcloned into a promoterless luciferase reporter vector (P1Luc) and used to monitor Runx1 promoter activity. Transfection with Runx1 resulted in ≈2.5-fold increase in luciferase activity. Cotransfection with Smad6 and Smurf1, however, reduced Runx1-mediated luciferase activity to baseline. (Ciii) The reduction in Runx1 activity in Cii correlates with a reduction in Runx1 protein expression. Myc-Runx1 band ODs are normalized to their respective GFP ODs and are reported as a percentage of the Myc-Runx1/GFP OD in lane 1. (D) The Runx1 P1 promoter is in an open chromatin configuration (enrichment of K9A at histone H3) in 416B cells and is bound by Runx1 and P-Smad1 in vivo. (E) Smad1 transactivates the Runx1 P1 promoter.
Fig. 6.
Integration of Runx1 and the BMP signaling pathway into the SCL transcriptional network. A schematic diagram of an emerging hematopoietic transcriptional network operating within the embryo during the establishment of definitive hematopoiesis in the AGM.
Similar articles
- A Runx1-Smad6 rheostat controls Runx1 activity during embryonic hematopoiesis.
Knezevic K, Bee T, Wilson NK, Janes ME, Kinston S, Polderdijk S, Kolb-Kokocinski A, Ottersbach K, Pencovich N, Groner Y, de Bruijn M, Göttgens B, Pimanda JE. Knezevic K, et al. Mol Cell Biol. 2011 Jul;31(14):2817-26. doi: 10.1128/MCB.01305-10. Epub 2011 May 16. Mol Cell Biol. 2011. PMID: 21576367 Free PMC article. - Runx genes are direct targets of Scl/Tal1 in the yolk sac and fetal liver.
Landry JR, Kinston S, Knezevic K, de Bruijn MF, Wilson N, Nottingham WT, Peitz M, Edenhofer F, Pimanda JE, Ottersbach K, Göttgens B. Landry JR, et al. Blood. 2008 Mar 15;111(6):3005-14. doi: 10.1182/blood-2007-07-098830. Epub 2008 Jan 9. Blood. 2008. PMID: 18184866 - Effect of endoglin overexpression during embryoid body development.
Baik J, Borges L, Magli A, Thatava T, Perlingeiro RC. Baik J, et al. Exp Hematol. 2012 Oct;40(10):837-46. doi: 10.1016/j.exphem.2012.06.007. Epub 2012 Jun 19. Exp Hematol. 2012. PMID: 22728030 Free PMC article. - SCL/TAL1 in Hematopoiesis and Cellular Reprogramming.
Hoang T, Lambert JA, Martin R. Hoang T, et al. Curr Top Dev Biol. 2016;118:163-204. doi: 10.1016/bs.ctdb.2016.01.004. Epub 2016 Feb 18. Curr Top Dev Biol. 2016. PMID: 27137657 Review. - Bone morphogenetic proteins.
Chen D, Zhao M, Mundy GR. Chen D, et al. Growth Factors. 2004 Dec;22(4):233-41. doi: 10.1080/08977190412331279890. Growth Factors. 2004. PMID: 15621726 Review.
Cited by
- Hematopoietic stem cell emergence in the conceptus and the role of Runx1.
Swiers G, de Bruijn M, Speck NA. Swiers G, et al. Int J Dev Biol. 2010;54(6-7):1151-63. doi: 10.1387/ijdb.103106gs. Int J Dev Biol. 2010. PMID: 20711992 Free PMC article. Review. - The Hemogenic Competence of Endothelial Progenitors Is Restricted by Runx1 Silencing during Embryonic Development.
Eliades A, Wareing S, Marinopoulou E, Fadlullah MZH, Patel R, Grabarek JB, Plusa B, Lacaud G, Kouskoff V. Eliades A, et al. Cell Rep. 2016 Jun 7;15(10):2185-2199. doi: 10.1016/j.celrep.2016.05.001. Epub 2016 May 26. Cell Rep. 2016. PMID: 27239041 Free PMC article. - A Runx1-Smad6 rheostat controls Runx1 activity during embryonic hematopoiesis.
Knezevic K, Bee T, Wilson NK, Janes ME, Kinston S, Polderdijk S, Kolb-Kokocinski A, Ottersbach K, Pencovich N, Groner Y, de Bruijn M, Göttgens B, Pimanda JE. Knezevic K, et al. Mol Cell Biol. 2011 Jul;31(14):2817-26. doi: 10.1128/MCB.01305-10. Epub 2011 May 16. Mol Cell Biol. 2011. PMID: 21576367 Free PMC article. - Transcriptional control of blood cell emergence.
Menegatti S, de Kruijf M, Garcia-Alegria E, Lacaud G, Kouskoff V. Menegatti S, et al. FEBS Lett. 2019 Dec;593(23):3304-3315. doi: 10.1002/1873-3468.13585. Epub 2019 Aug 31. FEBS Lett. 2019. PMID: 31432499 Free PMC article. Review. - Twist1 regulates embryonic hematopoietic differentiation through binding to Myb and Gata2 promoter regions.
Kulkeaw K, Inoue T, Iino T, Tani K, Akashi K, Speck NA, Nakanishi Y, Sugiyama D. Kulkeaw K, et al. Blood Adv. 2017 Aug 31;1(20):1672-1681. doi: 10.1182/bloodadvances.2017006056. eCollection 2017 Sep 12. Blood Adv. 2017. PMID: 29296814 Free PMC article.
References
- Davidson EH, Rast JP, Oliveri P, Ransick A, Calestani C, Yuh CH, Minokawa T, Amore G, Hinman V, Arenas-Mena C, et al. Science. 2002;295:1669–1678. - PubMed
Publication types
MeSH terms
Substances
LinkOut - more resources
Full Text Sources
Research Materials
Miscellaneous


