Ancestral genome sizes specify the minimum rate of lateral gene transfer during prokaryote evolution - PubMed (original) (raw)
Ancestral genome sizes specify the minimum rate of lateral gene transfer during prokaryote evolution
Tal Dagan et al. Proc Natl Acad Sci U S A. 2007.
Abstract
The amount of lateral gene transfer (LGT) that has occurred in microbial evolution is heavily debated. Efforts to quantify LGT through gene-tree comparisons have delivered estimates that between 2% and 60% of all prokaryotic genes have been affected by LGT, the 30-fold discrepancy reflecting differences among gene samples studied and uncertainties inherent in phylogenetic reconstruction. Here we present a simple method that is independent of gene-tree comparisons to estimate the LGT rate among sequenced prokaryotic genomes. If little or no LGT has occurred during evolution, ancestral genome sizes would become unrealistically large, whereas too much LGT would render them far too small. We determine the amount of LGT that is necessary and sufficient to bring the distribution of inferred ancestral genome sizes into agreement with that observed among modern microbes. Rather than testing for phylogenetic congruence or lack thereof across genes, we assume that all gene trees are compatible; hence, our method delivers very conservative lower-bound estimates of the average LGT rate. The results indicate that among 57,670 gene families distributed across 190 sequenced genomes, at least two-thirds and probably all, have been affected by LGT at some time in their evolutionary past. A component of common ancestry nonetheless remains detectable in gene distribution patterns. We estimate the minimum lower bound for the average LGT rate across all genes as 1.1 LGT events per gene family and gene family lifespan and this minimum rate increases sharply when genes present in only a few genomes are excluded from the analysis.
Conflict of interest statement
The authors declare no conflict of interest.
Figures
Fig. 1.
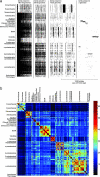
The distibution of genes across genomes. (a) Presence (black) and absence (white) patterns for representative segments of the data comprising widely (present in 100–190 genomes), intermediately (60–80 and 10–20 genomes), and sparsely distributed genes (two genomes). (Note the scale bar.) (b) Color-coded matrix of the proportion of shared genes for all genome pairs, with genomes grouped by taxonomical classification. For the same matrix using random genome order, see
SI Fig. 4
. The proportion of shared genes for a genome pair x,y is calculated as the number of genes in genomes x,y that are found in shared clusters, divided by the total genes in genomes x,y. The color scale indicates the shared proportions of genes in percent. For example, archaebacterial genome pairs share 32 ± 16% (mean ± SD) families on average, whereas archaebacterial vs. eubacterial genome pairs share only 7 ± 3% of their families. For cyanobacteria, 61 ± 10% of each genome consists of families shared with another cyanobacterium, as opposed to 18 ± 5% in comparisons to noncyanobacteria. For proteobacteria, γ-proteobacteria share 38 ± 13% common families with other γ-proteobacteria, 26 ± 7% with other proteobacteria, and 18 ± 8% with nonproteobacteria.
Fig. 2.
Gene loss and LGT can both account for patchy gene distributions. Schematic representation of four different LGT allowances. (a) In the loss-only model, all genes are assumed to have originated at the root of the tree; PAPs are attributed to gene loss only. (b) Introducing a gene origin in the SO model disperses gene origins over internal nodes of the tree according to their first occurrence. (c) In the LGT≤1 model, each gene is allowed to have two origins, where one is an LGT. This model results in further dispersal of gene origins across the tree, hence smaller ancestral genomes. (d) Two additional LGTs are allowed in the LGT≤3 model. Allowances of up to 7, 15, and 31 LGTs were also tested.
Fig. 3.
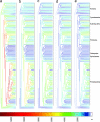
Ancestral genome sizes reconstructed under the various reconstruction models. The colors of nodes and branches correspond to the inferred ancestral genome size, as indicated in the scale. a_–_e correspond to the SO, LGT≤1, LGT≤3, LGT≤7, and LGT≤15 models, respectively (see
SI Figs. 7 and 8
for the same analysis using a reference tree reconstructed by neighbor joining and a random reference tree, respectively). To calculate the genome size in each hypothetical taxonomic unit, a binary recursive algorithm scans the reference tree from root to tips; the genome size of each hypothetical taxonomic unit is calculated as the cumulative sum of the origins minus the cumulative sum of losses inferred for previous nodes and the node itself.
Similar articles
- Directed networks reveal genomic barriers and DNA repair bypasses to lateral gene transfer among prokaryotes.
Popa O, Hazkani-Covo E, Landan G, Martin W, Dagan T. Popa O, et al. Genome Res. 2011 Apr;21(4):599-609. doi: 10.1101/gr.115592.110. Epub 2011 Jan 26. Genome Res. 2011. PMID: 21270172 Free PMC article. - Networks of gene sharing among 329 proteobacterial genomes reveal differences in lateral gene transfer frequency at different phylogenetic depths.
Kloesges T, Popa O, Martin W, Dagan T. Kloesges T, et al. Mol Biol Evol. 2011 Feb;28(2):1057-74. doi: 10.1093/molbev/msq297. Epub 2010 Nov 8. Mol Biol Evol. 2011. PMID: 21059789 Free PMC article. - A natural barrier to lateral gene transfer from prokaryotes to eukaryotes revealed from genomes: the 70 % rule.
Ku C, Martin WF. Ku C, et al. BMC Biol. 2016 Oct 17;14(1):89. doi: 10.1186/s12915-016-0315-9. BMC Biol. 2016. PMID: 27751184 Free PMC article. - Detecting lateral genetic transfer : a phylogenetic approach.
Beiko RG, Ragan MA. Beiko RG, et al. Methods Mol Biol. 2008;452:457-69. doi: 10.1007/978-1-60327-159-2_21. Methods Mol Biol. 2008. PMID: 18566777 Review. - Too Much Eukaryote LGT.
Martin WF. Martin WF. Bioessays. 2017 Dec;39(12). doi: 10.1002/bies.201700115. Epub 2017 Oct 25. Bioessays. 2017. PMID: 29068466 Review.
Cited by
- One step beyond a ribosome: The ancient anaerobic core.
Sousa FL, Nelson-Sathi S, Martin WF. Sousa FL, et al. Biochim Biophys Acta. 2016 Aug;1857(8):1027-1038. doi: 10.1016/j.bbabio.2016.04.284. Epub 2016 May 2. Biochim Biophys Acta. 2016. PMID: 27150504 Free PMC article. Review. - Host origin of plastid solute transporters in the first photosynthetic eukaryotes.
Tyra HM, Linka M, Weber AP, Bhattacharya D. Tyra HM, et al. Genome Biol. 2007;8(10):R212. doi: 10.1186/gb-2007-8-10-r212. Genome Biol. 2007. PMID: 17919328 Free PMC article. - The last universal common ancestor between ancient Earth chemistry and the onset of genetics.
Weiss MC, Preiner M, Xavier JC, Zimorski V, Martin WF. Weiss MC, et al. PLoS Genet. 2018 Aug 16;14(8):e1007518. doi: 10.1371/journal.pgen.1007518. eCollection 2018 Aug. PLoS Genet. 2018. PMID: 30114187 Free PMC article. Review. - Concerted gene recruitment in early plant evolution.
Huang J, Gogarten JP. Huang J, et al. Genome Biol. 2008;9(7):R109. doi: 10.1186/gb-2008-9-7-r109. Epub 2008 Jul 8. Genome Biol. 2008. PMID: 18611267 Free PMC article. - Gene and genome trees conflict at many levels.
Haggerty LS, Martin FJ, Fitzpatrick DA, McInerney JO. Haggerty LS, et al. Philos Trans R Soc Lond B Biol Sci. 2009 Aug 12;364(1527):2209-19. doi: 10.1098/rstb.2009.0042. Philos Trans R Soc Lond B Biol Sci. 2009. PMID: 19571241 Free PMC article.
References
- Ciccarelli FD, Doerks T, von Mering C, Creevey CJ, Snel B, Bork P. Science. 2006;311:1283–1287. - PubMed
- Doolittle WF. In: Microbial Phylogeny and Evolution: Concepts and Controversies. Sapp J, editor. New York: Oxford Univ Press; 2004. pp. 119–133.
- Gogarten JP, Doolittle WF, Lawrence JG. Mol Biol Evol. 2002;19:2226–2238. - PubMed
Publication types
MeSH terms
LinkOut - more resources
Full Text Sources
Other Literature Sources
Molecular Biology Databases
Miscellaneous


