Transcriptomal profiling of the cellular transformation induced by Rho subfamily GTPases - PubMed (original) (raw)
Transcriptomal profiling of the cellular transformation induced by Rho subfamily GTPases
I M Berenjeno et al. Oncogene. 2007.
Abstract
We have used microarray technology to identify the transcriptional targets of Rho subfamily guanosine 5'-triphosphate (GTP)ases in NIH3T3 cells. This analysis indicated that murine fibroblasts transformed by these proteins show similar transcriptomal profiles. Functional annotation of the regulated genes indicate that Rho subfamily GTPases target a wide spectrum of functions, although loci encoding proteins linked to proliferation and DNA synthesis/transcription are upregulated preferentially. Rho proteins promote four main networks of interacting proteins nucleated around E2F, c-Jun, c-Myc and p53. Of those, E2F, c-Jun and c-Myc are essential for the maintenance of cell transformation. Inhibition of Rock, one of the main Rho GTPase targets, leads to small changes in the transcriptome of Rho-transformed cells. Rock inhibition decreases c-myc gene expression without affecting the E2F and c-Jun pathways. Loss-of-function studies demonstrate that c-Myc is important for the blockage of cell-contact inhibition rather than for promoting the proliferation of Rho-transformed cells. However, c-Myc overexpression does not bypass the inhibition of cell transformation induced by Rock blockage, indicating that c-Myc is essential, but not sufficient, for Rock-dependent transformation. These results reveal the complexity of the genetic program orchestrated by the Rho subfamily and pinpoint protein networks that mediate different aspects of the malignant phenotype of Rho-transformed cells.
Figures
Figure 1
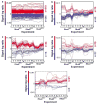
Transcriptomal changes in Rho-transformed cells. (a–e) Induced (red) and repressed (blue) genes that are regulated by the three GTPases (a), by RhoAQ63L alone (b), by RhoAQ63L and RhoBQ63L (c), by RhoAQ63L and RhoCQ63L (d) or by RhoBQ63L and RhoCQ63L (e) according to the statistical criteria. The expression values of the deregulated genes are represented as signal log ratio numbers (SLR, considering that fold change = 2SLR; _y_-axis) obtained in each experimental sample (_x_-axis). The total number of upregulated and downregulated genes is indicated on the right of each panel.
Figure 2
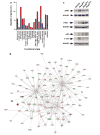
Functional annotation of Rho-regulated genes. (a) Classification of Rho-regulated genes according to general biological functions. Up- and down-regulated genes were colored in red and blue, respectively. (b) The c-Myc-, E2F1-, p53- and c-Jun-dependent networks identified using the Ingenuity database. Nodes are color-coded in red (upregulated) or green (downregulated) according to their fold change values. (c) Total cellular lysates from the indicated cell lines (top) were blotted with anti-phospho-Rb, anti-Myc, anti-p53 and anti-Jun antibodies. The same lysates were blotted with anti-tubulin antibodies to demonstrate equal loading of samples. p, phospho.
Figure 3
E2F function is essential for RhoAQ63L-mediated transformation. (a) Immunoblot analysis showing the expression of the ectopically expressed RhoAQ63L and RbΔCDK proteins in the cell lines under study. As control, we have included immunoblots lysates obtained from NIH3T3 and IMB11-1P cells (labeled as RhoAQ63L). For the visualization of RbΔCDK, cell lysates were immunoprecipitated (IP) with anti-HA antibodies and then blotted with the same antibody (upper panel). RhoAQ63L was detected in total cell lysates (TCL) by anti-AU5 immunobloting (middle panel). As loading control, we probed aliquots of the same total cellular extracts with anti-tubulin antibodies (lower panel). (b) Proliferation rates of the indicated cell lines. Values represent the mean of a representative experiment performed in triplicate. The arrow indicates the time point in which cells reached 100% confluency. (c) Determination of the transforming activity of NIH3T3, RhoAQ63L-transformed cells (IMB11-1P clone) and the indicated RhoAQ63L + RbΔCDK-expressing cells using secondary focus formation assays.
Figure 4
c-Myc and c-Jun, but not p53, are important for RhoAQ63L-dependent cell transformation. (a) NIH3T3 cells were transfected with the transactivation reporter plasmids (top) in the presence (RhoAQ63L) or absence (Mock) of the mammalian expression vector encoding RhoAQ63L and luciferase activities quantified as indicated in Supplementary Materials and methods . Values are expressed as fold change variations with respect to the appropriate control sample (that was given an arbitrary value of 1) and are the mean±s.d. of four independent experiments, each of them performed in triplicate. pP2_luc_, pM4_luc_, AP1_luc_ and p53_luc_ are reporter plasmids containing the c-myc promoter, c-Myc binding sites, AP1 binding sites and p53 binding sites, respectively. (b, c) Primary focus formation assays showing the transforming activity of RhoAQ63L when expressed alone or in combination of the indicated proteins. DNM, dominant-negative mutant.
Figure 5
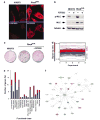
Effect of Y27632 on the transcriptome of RhoAQ63L-transformed cells. (a) Effect of Y27632 in the stress fibers of NIH3T3 (left panels) and RhoAQ63L-transformed (right panels) cells. F-actin and DAPI-stained nuclei are shown in red and blue, respectively. (b) Effect of Y27632 on MLC phosphorylation levels (upper panel). (c) Effect of Y27632 on the oncogenic activity of RhoAQ63L-transformed cells determined by secondary focus formation assays. (d) Graph showing the 179 genes induced (red) or repressed (blue) in RhoA-transformed cells after Y27632 treatment. The expression values of all deregulated genes are represented as in Figure 1. (e) Functional annotation of the 96 Y27632-dependent genes identified in the microrray analysis. (f) Identification of Y27632-regulated elements of the c-Myc-dependent network using the Ingenuity software. Nodes are color-coded as in Figure 2b.
Figure 6
c-Myc is important for the transforming activity, but not proliferation, of RhoAQ63L-transformed cells. (a) Expression of the indicated (left) ectopic (RhoAQ63L, c-Myc DNM) or endogenous (c-Myc, tubulin) proteins in NIH3T3 cells, IMB11-1P cells (labeled as RhoAQ63L, top), and a cell line co-expressing RhoAQ63L with the c-Myc dominant-negative mutant (DNM). Proteins were visualized in total cellular extracts by immunobloting with antibodies to c-Myc (upper panels), AU5 epitope (third panel) and tubulin (bottom panel). (b) A similar assay showing the expression of the indicated proteins (left) in NIH3T3 cells, IMB11-1P cells (labeled here as RhoAQ63L, top) and IMB11-1P-derived cell clones expressing either the c-myc shRNA or the empty pSUPER.GFP/neo. Proteins were visualized in total cellular extracts by immunobloting with antibodies to c-Myc (upper panel), the AU5 epitope (middle panel) and tubulin (bottom panel). (c) Proliferation rates of cell lines expressing the indicated proteins or shRNA. Values represent the mean of a representative experiment performed in triplicate. (d and e) Secondary focus formation assays showing the transforming activity of cells expressing RhoAQ63L alone or in combination with the indicated DNMs (d and e), shRNA (e) or vector controls (pSUPER.GFP/neo) (e). (f) Expression of the indicated proteins (left) in NIH3T3- (15-2-7, 15-2-11) and IMB11-1P-derived cell lines (16-2-P1, 16-2-P3, 16-2-11, 16-2-48) constitutively expressing c-Myc. Proteins were visualized in total cellular extracts by immunobloting with anti-c-Myc antibodies to detect the exogenous (upper panel) and endogenous (second panel from top) transcriptional factor, anti-AU5 antibodies (third panel from top) and anti-tubulin antibodies (bottom panel). (g) Secondary focus formation assay with cell lines expressing the indicated proteins (top). Cells were cultured in the absence or presence ( + Y27632) of the Rock inhibitor as indicated in Materials and methods.
Figure 7
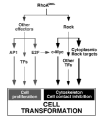
Schematic representation of the pathways activated by Rho proteins that contribute to proliferation and loss of cell contact inhibition, as inferred from the experimental data presented in this work.
Similar articles
- A novel strategy for specifically down-regulating individual Rho GTPase activity in tumor cells.
Wang L, Yang L, Luo Y, Zheng Y. Wang L, et al. J Biol Chem. 2003 Nov 7;278(45):44617-25. doi: 10.1074/jbc.M308929200. Epub 2003 Aug 25. J Biol Chem. 2003. PMID: 12939257 - RhoE inhibits cell cycle progression and Ras-induced transformation.
Villalonga P, Guasch RM, Riento K, Ridley AJ. Villalonga P, et al. Mol Cell Biol. 2004 Sep;24(18):7829-40. doi: 10.1128/MCB.24.18.7829-7840.2004. Mol Cell Biol. 2004. PMID: 15340047 Free PMC article. - Rit, a non-lipid-modified Ras-related protein, transforms NIH3T3 cells without activating the ERK, JNK, p38 MAPK or PI3K/Akt pathways.
Rusyn EV, Reynolds ER, Shao H, Grana TM, Chan TO, Andres DA, Cox AD. Rusyn EV, et al. Oncogene. 2000 Sep 28;19(41):4685-94. doi: 10.1038/sj.onc.1203836. Oncogene. 2000. PMID: 11032018 - Rho small G protein and cytoskeletal control.
Takai Y, Kaibuchi K, Sasaki T, Tanaka K, Shirataki H, Nakanishi H. Takai Y, et al. Princess Takamatsu Symp. 1994;24:338-50. Princess Takamatsu Symp. 1994. PMID: 8983086 Review. - Rho family proteins and Ras transformation: the RHOad less traveled gets congested.
Zohn IM, Campbell SL, Khosravi-Far R, Rossman KL, Der CJ. Zohn IM, et al. Oncogene. 1998 Sep 17;17(11 Reviews):1415-38. doi: 10.1038/sj.onc.1202181. Oncogene. 1998. PMID: 9779988 Review.
Cited by
- Patterns of cell signaling pathway activation that characterize mammary development.
Andrechek ER, Mori S, Rempel RE, Chang JT, Nevins JR. Andrechek ER, et al. Development. 2008 Aug;135(14):2403-13. doi: 10.1242/dev.019018. Epub 2008 Jun 11. Development. 2008. PMID: 18550711 Free PMC article. - Cooperative antiproliferative effect of coordinated ectopic expression of DLC1 tumor suppressor protein and silencing of MYC oncogene expression in liver cancer cells: Therapeutic implications.
Yang X, Zhou X, Tone P, Durkin ME, Popescu NC. Yang X, et al. Oncol Lett. 2016 Aug;12(2):1591-1596. doi: 10.3892/ol.2016.4781. Epub 2016 Jun 24. Oncol Lett. 2016. PMID: 27446476 Free PMC article. - Expression of VAV1 in the tumour microenvironment of glioblastoma multiforme.
Garcia JL, Couceiro J, Gomez-Moreta JA, Gonzalez Valero JM, Briz AS, Sauzeau V, Lumbreras E, Delgado M, Robledo C, Almunia ML, Bustelo XR, Hernandez JM. Garcia JL, et al. J Neurooncol. 2012 Oct;110(1):69-77. doi: 10.1007/s11060-012-0936-y. Epub 2012 Aug 4. J Neurooncol. 2012. PMID: 22864683 - Identification of the Rock-dependent transcriptome in rodent fibroblasts.
Berenjeno IM, Bustelo XR. Berenjeno IM, et al. Clin Transl Oncol. 2008 Nov;10(11):726-38. doi: 10.1007/s12094-008-0279-5. Clin Transl Oncol. 2008. PMID: 19015069 Free PMC article. - RhoGDIα-dependent balance between RhoA and RhoC is a key regulator of cancer cell tumorigenesis.
Giang Ho TT, Stultiens A, Dubail J, Lapière CM, Nusgens BV, Colige AC, Deroanne CF. Giang Ho TT, et al. Mol Biol Cell. 2011 Sep;22(17):3263-75. doi: 10.1091/mbc.E11-01-0020. Epub 2011 Jul 14. Mol Biol Cell. 2011. PMID: 21757538 Free PMC article.
References
- Barsyte-Lovejoy D, Mao DY, Penn LZ. c-Myc represses the proximal promoters of GADD45a and GADD153 by a post-RNA polymerase II recruitment mechanism. Oncogene. 2004;23:3481–3486. - PubMed
- Bolstad BM, Collin F, Simpson KM, Irizarry RA, Speed TP. Experimental design and low-level analysis of microarray data. Int Rev Neurobiol. 2004;60:25–58. - PubMed
- Budzyn K, Marley PD, Sobey CG. Targeting Rho and Rho-kinase in the treatment of cardiovascular disease. Trends Pharmacol Sci. 2006;27:97–104. - PubMed
- Calvano SE, Xiao W, Richards DR, Felciano RM, Baker HV, Cho RJ, et al. A network-based analysis of systemic inflammation in humans. Nature. 2005;437:1032–1037. - PubMed
- Chen C, Nussenzweig A, Guo M, Kim D, Li GC, Ling CC. Down-regulation of gadd153 by c-myc in rat fibroblasts and its effect on cell growth and radiation-induced apoptosis. Oncogene. 1996;13:1659–1665. - PubMed
Publication types
MeSH terms
Substances
LinkOut - more resources
Full Text Sources
Molecular Biology Databases
Research Materials
Miscellaneous


