The hypoxia-inducible factor 2alpha N-terminal and C-terminal transactivation domains cooperate to promote renal tumorigenesis in vivo - PubMed (original) (raw)
The hypoxia-inducible factor 2alpha N-terminal and C-terminal transactivation domains cooperate to promote renal tumorigenesis in vivo
Qin Yan et al. Mol Cell Biol. 2007 Mar.
Abstract
Hypoxia-inducible factor (HIF) is a heterodimeric transcription factor, consisting of an alpha subunit and a beta subunit, that controls cellular responses to hypoxia. HIFalpha contains two transcriptional activation domains called the N-terminal transactivation domain (NTAD) and the C-terminal transactivation domain (CTAD). HIFalpha is destabilized by prolyl hydroxylation catalyzed by EglN family members. In addition, CTAD function is inhibited by asparagine hydroxylation catalyzed by FIH1. Both hydroxylation reactions are linked to oxygen availability. The von Hippel-Lindau tumor suppressor protein (pVHL) is frequently mutated in kidney cancer and is part of the ubiquitin ligase complex that targets prolyl hydroxylated HIFalpha for destruction. Recent studies suggest that HIF2alpha plays an especially important role in promoting tumor formation by pVHL-defective renal carcinoma cells among the three HIFalpha paralogs. Here we dissected the relative contribution of the two HIF2alpha transactivation domains to hypoxic gene activation and renal carcinogenesis and investigated the regulation of the HIF2alpha CTAD by FIH1. We found that the HIF2alpha NTAD is capable of activating both artificial and naturally occurring HIF-responsive promoters in the absence of the CTAD. Moreover, we found that the HIF2alpha CTAD, in contrast to the HIF1alpha CTAD, is relatively resistant to the inhibitory effects of FIH1 under normoxic conditions and that, perhaps as a result, both the NTAD and CTAD cooperate to promote renal carcinogenesis in vivo.
Figures
FIG. 1.
HIF2α mutants used in the study. (A) Schematic of the HA-HIF2α mutants used in this study. The bHLH, PAS, NTAD, and CTAD domains are indicated by boxes. The bHLH mutation, Pro405-to-Ala, Pro531-to-Ala, and Asp847-to-Ala substitutions are indicated by asterisks in the corresponding regions. The Asp847-to-Gln substitution is indicated (#) in the corresponding region. (B) Alignment of the C-terminal regions of HIF1α and HIF2α from human (h), mouse (m), and rat (r). The fully conserved amino acids are indicated in gray, and the Asn hydroxylation site is indicated by the arrow.
FIG. 2.
Transcriptional activation by the HIF2α mutants. Normalized firefly luciferase values of U2OS cells transiently transfected to produce the indicated HIF2α variants along with a reporter plasmid containing firefly luciferase under the control of the VEGF promoter (VEGF-Luc) (A and C) or 3 tandem HIF-response elements and a minimal promoter (3×HRE-Luc) (B and D). Transfection mixes also contained plasmids encoding Renilla luciferase and, in some experiments, GFP for normalization purposes. Data are the averages of results from duplicate experiments ± standard errors. Production of the HIF2α mutants and GFP was assessed by Western blot (WB) analysis (lower panel). EV, empty vector control; RLU, relative luciferase unit.
FIG. 3.
Behavior of HIF2α variants when introduced into _VHL_−/− renal carcinoma cells stably transfected to produce wild-type pVHL. (A) Normalized firefly luciferase values of WT7 cells transiently transfected to produce the indicated HIF2α variants along with a reporter plasmid containing firefly luciferase under the control of 3 tandem HIF-response elements upstream of a minimal promoter. Transfection mixes also contained plasmids encoding Renilla luciferase for normalization purposes. Data are the averages of results from duplicate experiments ± standard errors. RLU, relative luciferase unit. (B) Western blot (WB) analysis of WT7 cells after stable infection with retroviruses encoding the indicated HIF2α mutants. Where indicated, media contained 100 μM CoCl2 for 16 h prior to harvest. EV, empty vector control.
FIG. 4.
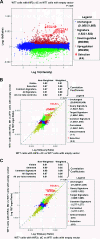
The NTAD is sufficient for HIF2α regulation of target gene expression. (A) The HIF2α dC variant up-regulates expression of canonical HIF target genes. RNA isolated from WT7 cells expressing HIF2α dC was compared to WT7 cells with the empty vector. Significantly up-regulated (red) or down-regulated (green) genes were determined as described previously (22). Canonical HIF target genes such as cyclin D1 (CCND1), GLUT1 (SLC2A1), VEGF, and EglN3 were highlighted. (B) The HIF2α dC and M1 variants up-regulate expression of canonical HIF target genes to similar levels. RNA isolated from WT7 cells expressing HIF2α dC or M1 variants were compared to WT7 cells with the empty vector, and these two data sets were compared to each other. Genes regulated in both the HIF2α dC and M1 experiments are yellow, those in the dC but not the M1 experiment are red, those in the M1 but not the dC experiment are green, and those in neither experiment are blue. Canonical HIF target genes such as cyclin D1 (CCND1), GLUT1 (SLC2A1), VEGF, and EglN3 were similarly up-regulated in HIF2α dC-expressing cells and M1-expressing cells. (C) HIF2α dC and M2 variants up-regulate expression of canonical HIF target genes to similar levels. RNA isolated from WT7 cells expressing HIF2α dC or M2 variants were compared to WT7 cells with the empty vector, and these two data sets were compared to each other. Genes regulated in both the dC experiment and the M2 experiment are yellow, those in the dC but not the M2 experiment are red, those in the M2 but not the dC experiment are green, and those in neither experiment are blue. Canonical HIF target genes such as cyclin D1 (CCND1), GLUT1 (SLC2A1), VEGF, and EglN3 were similarly up-regulated in HIF2α dC-expressing cells and M2-expressing cells.
FIG. 5.
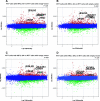
Comparison of gene expression profiles of WT7 cells expressing various HIF2α mutants. RNA isolated from WT7 cells expressing HIF2α M1 (A), dC (B), dN (C), and dNC (D) variants were compared to WT7 cells with the empty vector. Significantly up-regulated (red) or down-regulated (green) genes were determined as described previously (22). Canonical HIF target genes, such as cyclin D1 (CCND1), GLUT1 (SLC2A1), VEGF, EglN3, and HIG2, are highlighted.
FIG. 6.
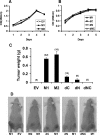
Proliferation of WT7 cells expressing various HIF2α mutants. (A and B) XTT assay of WT7 cells stably expressing the indicated HIF2α mutants after seeding in 96 well plates. Optical density (OD) at 450 nm values reflect the number of viable cells. Data are the averages of results from triplicate experiments ± standard errors (SE). (C) Tumor weights approximately 5 to 6 weeks after subcutaneous injection of WT7 cells stably expressing the indicated HIF2α mutants indicated in flanks of the nude mice. The number of tumors analyzed is indicated in parentheses. Error bars indicate ±SE. (D) Representative photographs of nude mice analyzed in panel C. EV, empty vector control.
FIG. 7.
Transcriptional activation by the HIF1α and HIF2α mutants. Normalized firefly luciferase values of U2OS cells transiently transfected to produce the indicated HIF1α (A and C) or HIF2α (B and D) variants along with a reporter plasmid containing firefly luciferase under the control of 3 tandem HIF-response elements upstream of a minimal promoter. Transfection mixes also contained plasmids encoding Renilla luciferase and, in some experiments, GFP for normalization purposes. Data are the averages of results from duplicate experiments ± standard errors. Production of the HIFα mutants, GFP, vinculin, and tubulin was assessed by Western blot (WB) analysis (lower panel). RLU, relative luciferase unit; EV, empty vector control.
FIG. 8.
Induction of HIF target genes in 786-O and RCC4 cells by CoCl2 treatment. 786-O and RCC4 cells were grown in the presence or absence of 200 μM CoCl2 for 16 h. Expression levels of the indicated HIF target genes were determined by quantitative, real-time reverse transcription-PCR and normalized to β-actin mRNA levels. Shown are relative changes after CoCl2 treatment. Data are the averages of results from triplicate experiments ± standard errors.
Similar articles
- Asparagine hydroxylation of the HIF transactivation domain a hypoxic switch.
Lando D, Peet DJ, Whelan DA, Gorman JJ, Whitelaw ML. Lando D, et al. Science. 2002 Feb 1;295(5556):858-61. doi: 10.1126/science.1068592. Science. 2002. PMID: 11823643 - Targeted inactivation of fh1 causes proliferative renal cyst development and activation of the hypoxia pathway.
Pollard PJ, Spencer-Dene B, Shukla D, Howarth K, Nye E, El-Bahrawy M, Deheragoda M, Joannou M, McDonald S, Martin A, Igarashi P, Varsani-Brown S, Rosewell I, Poulsom R, Maxwell P, Stamp GW, Tomlinson IP. Pollard PJ, et al. Cancer Cell. 2007 Apr;11(4):311-9. doi: 10.1016/j.ccr.2007.02.005. Cancer Cell. 2007. PMID: 17418408 - Clinical implications of hypoxia inducible factor in renal cell carcinoma.
Smaldone MC, Maranchie JK. Smaldone MC, et al. Urol Oncol. 2009 May-Jun;27(3):238-45. doi: 10.1016/j.urolonc.2007.12.001. Urol Oncol. 2009. PMID: 19414111 Review. - Transgenic models to understand hypoxia-inducible factor function.
Doedens A, Johnson RS. Doedens A, et al. Methods Enzymol. 2007;435:87-105. doi: 10.1016/S0076-6879(07)35005-2. Methods Enzymol. 2007. PMID: 17998050 Review.
Cited by
- Decoupling NAD+ metabolic dependency in chondrosarcoma by targeting the SIRT1-HIF-2α axis.
Suh J, Kim H, Min J, Yeon HJ, Hemberg M, Scimeca L, Wu MR, Kang HG, Kim YJ, Kim JH. Suh J, et al. Cell Rep Med. 2024 Jan 16;5(1):101342. doi: 10.1016/j.xcrm.2023.101342. Epub 2023 Dec 20. Cell Rep Med. 2024. PMID: 38128534 Free PMC article. - Lack of oxygen in articular cartilage: consequences for chondrocyte biology.
Lafont JE. Lafont JE. Int J Exp Pathol. 2010 Apr;91(2):99-106. doi: 10.1111/j.1365-2613.2010.00707.x. Int J Exp Pathol. 2010. PMID: 20384821 Free PMC article. Review. - The hypoxic microenvironment maintains glioblastoma stem cells and promotes reprogramming towards a cancer stem cell phenotype.
Heddleston JM, Li Z, McLendon RE, Hjelmeland AB, Rich JN. Heddleston JM, et al. Cell Cycle. 2009 Oct 15;8(20):3274-84. doi: 10.4161/cc.8.20.9701. Epub 2009 Oct 3. Cell Cycle. 2009. PMID: 19770585 Free PMC article. - Differential HIF2α Protein Expression in Human Carotid Body and Adrenal Medulla under Physiologic and Tumorigenic Conditions.
Celada L, Cubiella T, San-Juan-Guardado J, San José Martínez A, Valdés N, Jiménez-Fonseca P, Díaz I, Enguita JM, Astudillo A, Álvarez-González E, Sierra LM, Chiara MD. Celada L, et al. Cancers (Basel). 2022 Jun 17;14(12):2986. doi: 10.3390/cancers14122986. Cancers (Basel). 2022. PMID: 35740651 Free PMC article. - Hypoxia-inducible factor-2α and TGF-β signaling interact to promote normoxic glomerular fibrogenesis.
Hanna C, Hubchak SC, Liang X, Rozen-Zvi B, Schumacker PT, Hayashida T, Schnaper HW. Hanna C, et al. Am J Physiol Renal Physiol. 2013 Nov 1;305(9):F1323-31. doi: 10.1152/ajprenal.00155.2013. Epub 2013 Aug 14. Am J Physiol Renal Physiol. 2013. PMID: 23946285 Free PMC article.
References
- Bracken, C. P., A. O. Fedele, S. Linke, W. Balrak, K. Lisy, M. L. Whitelaw, and D. J. Peet. 2006. Cell-specific regulation of hypoxia-inducible factor (HIF)-1α and HIF-2α stabilization and transactivation in a graded oxygen environment. J. Biol. Chem. 281:22575-22585. - PubMed
- Bruick, R. K., and S. L. McKnight. 2001. A conserved family of prolyl-4-hydroxylases that modify HIF. Science 294:1337-1340. - PubMed
- Carroll, V. A., and M. Ashcroft. 2006. Role of hypoxia-inducible factor (HIF)-1α versus HIF-2α in the regulation of HIF target genes in response to hypoxia, insulin-like growth factor-I, or loss of von Hippel-Lindau function: implications for targeting the HIF pathway. Cancer Res. 66:6264-6270. - PubMed
- Covello, K. L., M. C. Simon, and B. Keith. 2005. Targeted replacement of hypoxia-inducible factor-1α by a hypoxia-inducible factor-2α knock-in allele promotes tumor growth. Cancer Res. 65:2277-2286. - PubMed
Publication types
MeSH terms
Substances
LinkOut - more resources
Full Text Sources
Other Literature Sources
Medical
Research Materials


