Identification of secondary structure elements in intermediate-resolution density maps - PubMed (original) (raw)
Identification of secondary structure elements in intermediate-resolution density maps
Matthew L Baker et al. Structure. 2007 Jan.
Abstract
An increasing number of structural studies of large macromolecular complexes, both in X-ray crystallography and cryo-electron microscopy, have resulted in intermediate-resolution (5-10 A) density maps. Despite being limited in resolution, significant structural and functional information may be extractable from these maps. To aid in the analysis and annotation of these complexes, we have developed SSEhunter, a tool for the quantitative detection of alpha helices and beta sheets. Based on density skeletonization, local geometry calculations, and a template-based search, SSEhunter has been tested and validated on a variety of simulated and authentic subnanometer-resolution density maps. The result is a robust, user-friendly approach that allows users to quickly visualize, assess, and annotate intermediate-resolution density maps. Beyond secondary structure element identification, the skeletonization algorithm in SSEhunter provides secondary structure topology, which is potentially useful in leading to structural models of individual molecular components directly from the density.
Figures
Figure 1
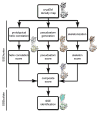
Flowchart for identification of secondary structure elements in SSEhunter. Three independent scoring algorithms, correlation with a prototypical α-helix (yellow density), pseudoatom geometry (orange spheres) and density skeletonization (red density), are combined to form a composite SSEhunter score which can be mapped back to individual pseudoatoms (blue to red spheres). Based on this score, a user can then annotate the secondary structure elements using SSEbuilder (cyan and green polygons).
Figure 2
Data representation in SSEhunter. During the identification of secondary structure elements, pseudoatoms are first generated to approximate the density distribution of the density map. The pseudoatom representation for the 8Å resolution simulated density map of 2BTV VP7 is shown in (A). These pseudoatoms are subsequently scored using several metrics based on their local environment. As examples, a pseudoatom in an α-helix (green, α) and its two closest neighboring pseudoatoms form nearly a straight line, while β-sheets contains multiple pseudoatoms with similar distances to each other (cyan, β). Skeletonization of the density then occurs and is shown in (B). The results of cross-correlation with a prototypical α-helix are shown in (C). Finally, the scores from skeletonization, cross-correlation and local geometry predicates are mapped back to individual pseudoatoms and colored based on their propensity to be α-helical (red) or β-sheet (blue) (D). The final annotation of VP7 is shown in (E), where α-helices are represented as green cylinders and β-sheets are shown as cyan planes.
Figure 3
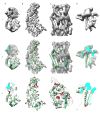
Secondary structure element identification on simulated density maps at 8 Å resolution. Four model structures, bacteriorhodopsin (A, pdb id: 1C3W), triose phosphate isomerase (B, pdb id: 1TIM), insulin receptor tyrosine kinase domain (C, 1IRK) and a trimer of bluetongue virus capsid protein VP7 (D, 2BTV), were used for validation. Column 1 shows a ribbon diagram for each of the structures, while column 2 shows the 8Å resolution simulated density maps. In column 3, the results of secondary structure identification are shown, represented by green α-helices and cyan β-sheets. Comparison of the X-ray structure and identified secondary structure elements are shown in column 4. Deviations from the real structure are colored in red. Only one monomer of the 2BTV trimer was analyzed.
Figure 4
Resolution assessment of simulated data. Structural analysis of the four simulated test structures was carried out at 6, 8 and 10Å resolution. Shown in (A) is a monomer from 2BTV; (B) and (C) show simulated density at 6 and 10Å resolution with their resulting secondary structures determined by SSEhunter, respectively. Figure 2 contains the 8Å resolution data. Similar results were obtained with the other three structures at the equivalent resolutions.
Figure 5
Secondary structure element identification on authentic cryoEM density maps. The 6.8Å resolution RDV (EMDB ID: 1060) capsid proteins, P8 and P3, are shown in columns (A) and (B). The upper domain of a hexon subunit, containing both VP5 and VP26, from the 8Å resolution HSV-1 cryoEM density map is shown in column (C). A Gp5 monomer from the 9.5Å resolution structure of the P22 phage (EMDB ID: 1101) is shown in column (D). The results of SSEhunter (row 2) on the corresponding density maps (row 1) are shown where α-helices are represented as green cylinders and β-sheets as cyan polygons. The X-ray structures, fit to the cryoEM density using FOLDHUNTER, are shown superimposed on the SSEhunter results in row 3 (PDB IDs: 1UF2, 1NO7 and 1OHG). Discrepancies in identification are colored in red. In HSV-1 VP5, only the upper domain is shown as only this region has a corresponding high-resolution structure. No x-ray structure for GP5 of P22 is known, however the structural homolog, Gp5 from HK97, is shown in row 3, column (D).
Figure 6
SSEhunter skeleton from segmented cryoEM density of RDV P8. The segmented cryoEM density is shown in grey with the skeleton in red (A). In (B), a zoomed in view of portion of the lower domain of P8 is shown with the X-ray structure (1UF2, ribbon) superimposed on the density map and skeleton, illustrating the ability of the skeleton to approximate the polypeptide chain. While the skeleton does approximate the overall path of the polypeptide chain, the exact path in the skeleton is ambiguous in certain regions containing branches and breaks corresponding to the density features.
Similar articles
- Identification of alpha-helices from low resolution protein density maps.
Dal Palù A, He J, Pontelli E, Lu Y. Dal Palù A, et al. Comput Syst Bioinformatics Conf. 2006:89-98. Comput Syst Bioinformatics Conf. 2006. PMID: 17369628 - Gorgon and pathwalking: macromolecular modeling tools for subnanometer resolution density maps.
Baker ML, Baker MR, Hryc CF, Ju T, Chiu W. Baker ML, et al. Biopolymers. 2012 Sep;97(9):655-68. doi: 10.1002/bip.22065. Biopolymers. 2012. PMID: 22696403 Free PMC article. - Three-Dimensional Graph Matching to Identify Secondary Structure Correspondence of Medium-Resolution Cryo-EM Density Maps.
Behkamal B, Naghibzadeh M, Saberi MR, Tehranizadeh ZA, Pagnani A, Al Nasr K. Behkamal B, et al. Biomolecules. 2021 Nov 26;11(12):1773. doi: 10.3390/biom11121773. Biomolecules. 2021. PMID: 34944417 Free PMC article. - Hybrid approaches: applying computational methods in cryo-electron microscopy.
Lindert S, Stewart PL, Meiler J. Lindert S, et al. Curr Opin Struct Biol. 2009 Apr;19(2):218-25. doi: 10.1016/j.sbi.2009.02.010. Epub 2009 Mar 30. Curr Opin Struct Biol. 2009. PMID: 19339173 Free PMC article. Review. - Computational tools in protein crystallography.
Jain D, Lamour V. Jain D, et al. Methods Mol Biol. 2010;673:129-56. doi: 10.1007/978-1-60761-842-3_8. Methods Mol Biol. 2010. PMID: 20835796 Review.
Cited by
- Epitope insertion at the N-terminal molecular switch of the rabbit hemorrhagic disease virus T = 3 capsid protein leads to larger T = 4 capsids.
Luque D, González JM, Gómez-Blanco J, Marabini R, Chichón J, Mena I, Angulo I, Carrascosa JL, Verdaguer N, Trus BL, Bárcena J, Castón JR. Luque D, et al. J Virol. 2012 Jun;86(12):6470-80. doi: 10.1128/JVI.07050-11. Epub 2012 Apr 4. J Virol. 2012. PMID: 22491457 Free PMC article. - Tools for macromolecular model building and refinement into electron cryo-microscopy reconstructions.
Brown A, Long F, Nicholls RA, Toots J, Emsley P, Murshudov G. Brown A, et al. Acta Crystallogr D Biol Crystallogr. 2015 Jan 1;71(Pt 1):136-53. doi: 10.1107/S1399004714021683. Epub 2015 Jan 1. Acta Crystallogr D Biol Crystallogr. 2015. PMID: 25615868 Free PMC article. - Structural changes in a marine podovirus associated with release of its genome into Prochlorococcus.
Liu X, Zhang Q, Murata K, Baker ML, Sullivan MB, Fu C, Dougherty MT, Schmid MF, Osburne MS, Chisholm SW, Chiu W. Liu X, et al. Nat Struct Mol Biol. 2010 Jul;17(7):830-6. doi: 10.1038/nsmb.1823. Epub 2010 Jun 13. Nat Struct Mol Biol. 2010. PMID: 20543830 Free PMC article. - Combining Cryo-EM Density Map and Residue Contact for Protein Secondary Structure Topologies.
Alshammari M, He J. Alshammari M, et al. Molecules. 2021 Nov 22;26(22):7049. doi: 10.3390/molecules26227049. Molecules. 2021. PMID: 34834140 Free PMC article. - A structural model of the pore-forming region of the skeletal muscle ryanodine receptor (RyR1).
Ramachandran S, Serohijos AW, Xu L, Meissner G, Dokholyan NV. Ramachandran S, et al. PLoS Comput Biol. 2009 Apr;5(4):e1000367. doi: 10.1371/journal.pcbi.1000367. Epub 2009 Apr 24. PLoS Comput Biol. 2009. PMID: 19390614 Free PMC article.
References
- Baker ML, Jiang W, Bowman BR, Zhou ZH, Quiocho FA, Rixon FJ, Chiu W. Architecture of the herpes simplex virus major capsid protein derived from structural bioinformatics. J Mol Biol. 2003;331:447–456. - PubMed
- Ban N, Nissen P, Hansen J, Moore PB, Steitz TA. The complete atomic structure of the large ribosomal subunit at 2.4 Å resolution. Science. 2000;289:905–920. - PubMed
- Banner DW, Bloomer A, Petsko GA, Phillips DC, Wilson IA. Atomic coordinates for triose phosphate isomerase from chicken muscle. Biochem Biophys Res Commun. 1976;72:146–155. - PubMed
- Booth CR, Jiang W, Baker ML, Zhou ZH, Ludtke SJ, Chiu W. A 9 angstroms single particle reconstruction from CCD captured images on a 200 kV electron cryomicroscope. J Struct Biol. 2004;147:116–127. - PubMed
Publication types
MeSH terms
Substances
LinkOut - more resources
Full Text Sources


