The neck of caveolae is a distinct plasma membrane subdomain that concentrates insulin receptors in 3T3-L1 adipocytes - PubMed (original) (raw)
The neck of caveolae is a distinct plasma membrane subdomain that concentrates insulin receptors in 3T3-L1 adipocytes
Michelangelo Foti et al. Proc Natl Acad Sci U S A. 2007.
Abstract
Insulin receptors (IRs) segregate on plasma membrane microvilli, but in cells devoid of microvilli, such as adipocytes, the localization of IRs is a matter of controversy. In the present study, we examined the distribution of IRs in the plasma membrane of 3T3-L1 adipocytes. Quantitative electron microscopy indicates that IRs are predominantly associated with the neck, but not the bulb, of caveolae. Caveola necks represent distinct microdomains of the plasma membrane. Indeed, as shown by freeze-fracture analysis, intramembrane particles are concentrated as necklaces around the craters of caveolae. In addition, subcellular fractionation suggests that the neck and the bulb of caveolae present a different resistance to detergent solubility. Finally, cytoskeletal components, including actin, are highly enriched in the membrane area underlying the neck part of caveolae. IRs coimmunoprecipitate with cytoskeletal components, and disruption of the actin cytoskeleton alters IRs expression, localization, and signaling, thus supporting the notion that caveola necks are involved in intracellular signaling by IRs. Together, these results suggest that cytoskeletal proteins anchor IRs to microdomains in the caveola necks of 3T3-L1 adipocytes. By homology with IR localization in other cell types, we suggest that the necks of caveolae may represent the counterpart of microvillar domains in cells poor in microvilli such as adipocytes and that they play an important role as signaling platforms.
Conflict of interest statement
The authors declare no conflict of interest.
Figures
Fig. 1.
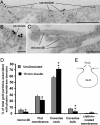
IRs associate with caveolar microdomains. (A) Electron micrograph of IR gold labeling associated with caveolae (arrows) on 3T3-L1 adipocyte plasma membrane sheets. (Scale bar, 0.1 μm.) (B) Quantification of IR association and enrichment in caveolae. Data are means ± SE of quantifications performed on 10 micrographs together totaling 41.4 μm2 of membranes and 1,000 gold particles.
Fig. 2.
IRs associate with the neck of caveolae and microvilli. Electron micrographs show IR gold labeling on the necks of caveolae (A and B) and on microvilli (C) of 3T3-L1 adipocytes. (Scale bar, 0.25 μm.) (D) Quantification of IR association with distinct plasma membrane microdomains. Data are means ± SE of quantifications performed on 98–101 micrographs from two experiments together totaling 103 cells per 2,665 gold particles and 102 cells per 2,105 gold particles for unstimulated and insulin-stimulated cells, respectively. *, P < 0.05; **, P < 0.01. (E) Scheme of a caveola. Black dotted lines, caveola neck areas; gray line, caveola bulb.
Fig. 3.
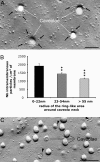
The caveola necks concentrate intramembrane particles including the IRs. (A) Freeze–fracture replica of a 3T3-L1 adipocyte showing accumulation of intramembrane particles (arrows) around the neck of the caveola craters in the protoplasmic face of the membrane. (Scale bar, 0.1 μm.) (B) Quantification of intramembrane particle densities in concentric ring-like areas surrounding the caveola craters. Data are means ± SE of particle densities ≈50 caveolae. **, P < 0.01; ***, P < 0.001. (C) Freeze–fracture replica showing IR gold-associated particles (arrowheads) around the neck of the caveolae in the exoplasmic face of the membrane. (Scale bar, 0.2 μm.)
Fig. 4.
IR cofractionation with caveolar membranes is detergent-sensitive. Typical distribution of IR, transferrin receptor (TfR), caveolin (Cav.), and GM1 in caveola-enriched subcellular fractions of 3T3-L1 adipocytes prepared either in the presence or absence of various detergents is shown. Data are representative of three independent experiments.
Fig. 5.
Microvilli and the neck of caveolae are enriched in cytoskeletal elements. Electron micrographs show immunogold labeling of cytoskeletal proteins in the cytoplasm underlying microvillar and caveolar neck microdomains. (A) High actin content of microvilli. (Scale bar, 0.2 μm.) Actin (B), ERM (C), and talin (D) are detected in the cytoplasmic area close to the neck curve of caveolae. (Scale bars, B, 0.1 μm; C and D, 0.2 μm.)
Fig. 6.
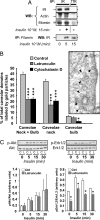
Cytoskeleton disruption affects IR association with caveolae and signaling. (A) Coimmunoprecipitation of IRs with actin, moesin, and filamin in 3T3-L1 adipocytes. Immunoprecipitation of the transferrin receptor (TfR) was used as a control. Data are representative of three to five independent experiments. (B) Effect of actin-disrupting drugs on IR association with caveolae. The micrograph shows that caveolae (arrowheads) are preserved in latrunculin-treated cells. The graph indicates the percentage of caveolar structures that are labeled by IR-associated gold particles in cells pretreated or not with latrunculin (45 μM, 3 h at 37°C) or cytochalasin D (20 μg/ml, 3 h at 37°C). Data are means ± SE of quantifications performed on 49–98 electron micrographs for each condition, totaling 52 cells per 549 gold particles per 1,447 caveolae, 79 cells per 573 gold particles per 1,512 caveolae, and 52 cells per 589 gold particles per 1,787 caveolae analyzed for control, latrunculin-, and cytochalasin D-treated cells, respectively. *, P < 0.05; ***, P < 0.001. (C) Akt and ERK1/2 phosphorylation by insulin. Cells were treated (L) or not (C) with latrunculin (45 μM, 3 h at 37°C) and stimulated with 10−8 M insulin for different times. A representative Western blot of phosphorylated Akt and ERK1/2 is shown as well as quantifications of the ratio of phosphorylated to total proteins. Results are the mean ± SE of three independent experiments. * P < 0.05.
Similar articles
- Caveolin-1 loss of function accelerates glucose transporter 4 and insulin receptor degradation in 3T3-L1 adipocytes.
González-Muñoz E, López-Iglesias C, Calvo M, Palacín M, Zorzano A, Camps M. González-Muñoz E, et al. Endocrinology. 2009 Aug;150(8):3493-502. doi: 10.1210/en.2008-1520. Epub 2009 Apr 30. Endocrinology. 2009. PMID: 19406948 - Activation of the mammalian target of rapamycin pathway acutely inhibits insulin signaling to Akt and glucose transport in 3T3-L1 and human adipocytes.
Tremblay F, Gagnon A, Veilleux A, Sorisky A, Marette A. Tremblay F, et al. Endocrinology. 2005 Mar;146(3):1328-37. doi: 10.1210/en.2004-0777. Epub 2004 Dec 2. Endocrinology. 2005. PMID: 15576463 - The subcellular fractionation properties and function of insulin receptor substrate-1 (IRS-1) are independent of cytoskeletal integrity.
Thomas EC, Zhe Y, Molero JC, Schmitz-Peiffer C, Ramm G, James DE, Whitehead JP. Thomas EC, et al. Int J Biochem Cell Biol. 2006;38(10):1686-99. doi: 10.1016/j.biocel.2006.03.009. Epub 2006 Apr 3. Int J Biochem Cell Biol. 2006. PMID: 16702017 - Cell volume regulation and signaling in 3T3-L1 pre-adipocytes and adipocytes: on the possible roles of caveolae, insulin receptors, FAK and ERK1/2.
Eduardsen K, Larsen SL, Novak I, Lambert IH, Hoffmann EK, Pedersen SF. Eduardsen K, et al. Cell Physiol Biochem. 2011;28(6):1231-46. doi: 10.1159/000335855. Epub 2011 Dec 16. Cell Physiol Biochem. 2011. PMID: 22179011 - Role of caveolin and caveolae in insulin signaling and diabetes.
Cohen AW, Combs TP, Scherer PE, Lisanti MP. Cohen AW, et al. Am J Physiol Endocrinol Metab. 2003 Dec;285(6):E1151-60. doi: 10.1152/ajpendo.00324.2003. Am J Physiol Endocrinol Metab. 2003. PMID: 14607781 Review.
Cited by
- The shape of caveolae is omega-like after glutaraldehyde fixation and cup-like after cryofixation.
Schlörmann W, Steiniger F, Richter W, Kaufmann R, Hause G, Lemke C, Westermann M. Schlörmann W, et al. Histochem Cell Biol. 2010 Feb;133(2):223-8. doi: 10.1007/s00418-009-0651-8. Epub 2009 Oct 23. Histochem Cell Biol. 2010. PMID: 19851779 - Mass and information feedbacks through receptor endocytosis govern insulin signaling as revealed using a parameter-free modeling framework.
Brännmark C, Palmér R, Glad ST, Cedersund G, Strålfors P. Brännmark C, et al. J Biol Chem. 2010 Jun 25;285(26):20171-9. doi: 10.1074/jbc.M110.106849. Epub 2010 Apr 26. J Biol Chem. 2010. PMID: 20421297 Free PMC article. - Dissociation of the insulin receptor and caveolin-1 complex by ganglioside GM3 in the state of insulin resistance.
Kabayama K, Sato T, Saito K, Loberto N, Prinetti A, Sonnino S, Kinjo M, Igarashi Y, Inokuchi J. Kabayama K, et al. Proc Natl Acad Sci U S A. 2007 Aug 21;104(34):13678-83. doi: 10.1073/pnas.0703650104. Epub 2007 Aug 15. Proc Natl Acad Sci U S A. 2007. PMID: 17699617 Free PMC article. - Cholesterol-enriched membrane microdomains are needed for insulin signaling and proliferation in hepatic cells.
Fonseca MC, França A, Florentino RM, Fonseca RC, Lima Filho ACM, Vidigal PTV, Oliveira AG, Dubuquoy L, Nathanson MH, Leite MF. Fonseca MC, et al. Am J Physiol Gastrointest Liver Physiol. 2018 Jul 1;315(1):G80-G94. doi: 10.1152/ajpgi.00008.2018. Epub 2018 Feb 22. Am J Physiol Gastrointest Liver Physiol. 2018. PMID: 29471671 Free PMC article. - Caveolae regulation of mechanosensitive channel function in myotubes.
Huang H, Bae C, Sachs F, Suchyna TM. Huang H, et al. PLoS One. 2013 Aug 30;8(8):e72894. doi: 10.1371/journal.pone.0072894. eCollection 2013. PLoS One. 2013. PMID: 24023653 Free PMC article.
References
- Carpentier JL. Histochemistry. 1993;100:169–184. - PubMed
- Foti M, Moukil MA, Dudognon P, Carpentier JL. Novartis Found Symp. 2004;262:125–147. 265–268. - PubMed
- Condeelis J. Annu Rev Cell Biol. 1993;9:411–444. - PubMed
- He HJ, Kole S, Kwon YK, Crow MT, Bernier M. J Biol Chem. 2003;278:27096–27104. - PubMed
Publication types
MeSH terms
Substances
LinkOut - more resources
Full Text Sources


