Glucose-responsive regulators of gene expression in Saccharomyces cerevisiae function at the nuclear periphery via a reverse recruitment mechanism - PubMed (original) (raw)
Comparative Study
Glucose-responsive regulators of gene expression in Saccharomyces cerevisiae function at the nuclear periphery via a reverse recruitment mechanism
Nayan J Sarma et al. Genetics. 2007 Mar.
Abstract
Regulation of gene transcription is a key feature of developmental, homeostatic, and oncogenic processes. The reverse recruitment model of transcriptional control postulates that eukaryotic genes become active by moving to contact transcription factories at nuclear substructures; our previous work showed that at least some of these factories are tethered to nuclear pores. We demonstrate here that the nuclear periphery is the site of key events in the regulation of glucose-repressed genes, which together compose one-sixth of the Saccharomyces cerevisiae genome. We also show that the canonical glucose-repressed gene SUC2 associates tightly with the nuclear periphery when transcriptionally active but is highly mobile when repressed. Strikingly, SUC2 is both derepressed and confined to the nuclear rim in mutant cells where the Mig1 repressor is nuclear but not perinuclear. Upon derepression all three subunits (alpha, beta, and gamma) of the positively acting Snf1 kinase complex localize to the nuclear periphery, resulting in phosphorylation of Mig1 and its export to the cytoplasm. Reverse recruitment therefore appears to explain a fundamental pathway of eukaryotic gene regulation.
Figures
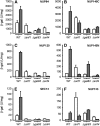
Figure 1.—
Derepression of nucleoporin-mediated transcription requires the Snf1 kinase complex. Wild type (WT), Δ_snf1_, Δ_gal83_, and Δ_snf4_ strains containing a chromosomally integrated lexA-driven reporter gene were transformed with nucleoporin-lexA fusion genes as described previously and assayed for β-galactosidase activity after growth in either the presence (open bars, repression) or the absence (shaded bars, derepression) of glucose. Each of the nucleoporin-lexA fusion genes tested in this assay was expressed at normal levels, i.e., was driven by its native promoter. LexA fusion genes are (A) NUP84, (B) NUP145C, (C) NUP120, (D) NUP145N, (E) SEC13, and (F) NUP133. Error bars represent the standard deviation of four independent determinations. Reporter expression driven by control proteins, which included Ste12-lexA and Gcn4-lexA chimeras, was similar in the presence or absence of Snf1 kinase subunits.
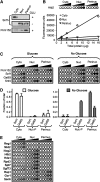
Figure 2.—
The active Snf1 kinase complex cofractionates with perinuclear components. Cyto, cytoplasmic fraction; Nuc, combined nucleoplasmic/perinuclear fraction; Perinuc, perinuclear fraction; Glu or Glucose, extracts from glucose-grown cells. (A) (Top and middle) Western blot of Snf1; (bottom) Western blot of Pom152. (B) Quantitative fluorescent protein detection (QFPD) assay. Increasing amounts of total protein from indicated fractions containing H2B-GFP were loaded into microtiter wells (circles, left to right), and fluorescence was measured as described in
materials and methods
; the graph shows the corresponding densitometric analysis. (C) QFPD analysis of Snf1-GFP, Snf4-GFP, and Gal83-GFP as in B above. (D) Densitometric analysis of the data shown in C. The fraction of total Snf1-GFP and Gal83-GFP fluorescence present in cytoplasmic (Cyto), nucleoplasmic (Nuc-P, total nuclear fluorescence minus perinuclear fluorescence), and perinuclear (Perinuc) fractions is represented. Open bars, glucose; shaded bars, no glucose. Error bars represent the standard error of the mean. (E) QFPD assay of nuclear proteins. Cytoplasmic Reg1 and Mid2, nucleolar Nog2, and perinuclear Rap1 and Gcr1 are shown as controls.
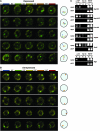
Figure 3.—
SUC2 exhibits carbon-source-dependent motility and associates with NPCs. Time-lapse analysis (4 min total) of the location of GFP-tagged SUC2 in either (A) repressed or (B) derepressed cells is shown; the result for each of five different nuclei in either repressing or derepressing conditions is presented horizontally in temporal order from left to right. The cartoon on the right depicts the location of the gene within the nucleus at the time indicated, in seconds: 0 (blue), 60 (green), 120 (yellow), 180 (orange), and 240 (red). A YFP fusion to the essential NPC component Nsp1 marks the nuclear periphery. (C) ChIP analysis of association between SUC2 and factors that represent different strata of the nuclear periphery. TAP-tagged Nup53 (NPC subunit), Nup133 (NPC subunit), Nup145 (NPC subunit), Pom152 (NPC-specific integral nuclear membrane protein), or Ssn6 (perinuclear Mig1 corepressor; see Figure 2E), or HA-tagged Mig1, were immunoprecipitated from cells grown on either the presence (R, repressed) or absence (D, derepressed) of glucose. The SUC2 promoter and ACT1 (negative control) promoter were amplified from both immunoprecipitated material and whole-cell extracts (INPUT, positive control). No Ab, no antibody (negative control).
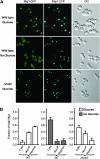
Figure 4.—
Perinuclear localization is required for repression by Mig1. (A) Confocal laser scanning microscopy of Mig1-GFP in wild-type or Δ_hxk2_ cells grown in either the presence or the absence of glucose, as indicated; coexpressed Rap1-CFP is shown as a nuclear marker. GFP and CFP signals were captured by using a Zeiss LSM 510 META confocal laser scanning microscope with a 63× Plan-Apochromat 1.4 NA oil DIC objective lens. Signals were separated with a 490-nm dichroic mirror with long pass filters adjusted to 505 and 475 nm, respectively. Pinholes were adjusted to obtain <1.8-μm optical slices. Images were acquired with the Zeiss LSM 510 software version 3.2. (B) Graphs show the fraction of total Mig1-GFP fluorescence present in cytoplasmic (Cyto), nucleoplasmic (Nuc-P, total nuclear fluorescence minus perinuclear fluorescence), and perinuclear (Perinuc) fractions, as determined by QFPD analysis. Open bars, glucose; shaded bars, no glucose. Error bars represent the standard error of the mean.
Figure 5.—
Models for localization of induced genes to nuclear substructures. The relocation of active genes can be modeled in three distinct ways. (A) In the processing and export model, the transcript produced by active RNA polymerase II (POL) associates with a nuclear pore complex (NPC), resulting in the relocation of the active gene to the nuclear periphery. (B) Alternatively, an early event in transcriptional activation, such as promoter opening or initiation, triggers the relocation of a gene. (C) Finally, the movement of a gene may bring it into contact with a nuclear substructure, such as the NPC, where RNA polymerase II molecules are tethered. We refer to this model as reverse recruitment. The central concept of this model is that the promoter of a gene mediates both its movement to the periphery and its interaction with nuclear substructures. (D) The reverse recruitment model can also be applied to lumenal substructures. It is possible that there exist subsets of eukaryotic genes that are brought to the nuclear periphery via each of the models in A–D.
Similar articles
- Hxk2 regulates the phosphorylation state of Mig1 and therefore its nucleocytoplasmic distribution.
Ahuatzi D, Riera A, Pela Ez R, Herrero P, Moreno F. Ahuatzi D, et al. J Biol Chem. 2007 Feb 16;282(7):4485-4493. doi: 10.1074/jbc.M606854200. Epub 2006 Dec 18. J Biol Chem. 2007. PMID: 17178716 - The nuclear exportin Msn5 is required for nuclear export of the Mig1 glucose repressor of Saccharomyces cerevisiae.
DeVit MJ, Johnston M. DeVit MJ, et al. Curr Biol. 1999 Nov 4;9(21):1231-41. doi: 10.1016/s0960-9822(99)80503-x. Curr Biol. 1999. PMID: 10556086 - Transcriptional control of nonfermentative metabolism in the yeast Saccharomyces cerevisiae.
Schüller HJ. Schüller HJ. Curr Genet. 2003 Jun;43(3):139-60. doi: 10.1007/s00294-003-0381-8. Epub 2003 Apr 25. Curr Genet. 2003. PMID: 12715202 Review. - Glucose control in Saccharomyces cerevisiae: the role of Mig1 in metabolic functions.
Klein CJL, Olsson L, Nielsen J. Klein CJL, et al. Microbiology (Reading). 1998 Jan;144 ( Pt 1):13-24. doi: 10.1099/00221287-144-1-13. Microbiology (Reading). 1998. PMID: 9467897 Review. No abstract available.
Cited by
- Cellular memory of acquired stress resistance in Saccharomyces cerevisiae.
Guan Q, Haroon S, Bravo DG, Will JL, Gasch AP. Guan Q, et al. Genetics. 2012 Oct;192(2):495-505. doi: 10.1534/genetics.112.143016. Epub 2012 Jul 30. Genetics. 2012. PMID: 22851651 Free PMC article. - Spatial organization of genes as a component of regulated expression.
Pai DA, Engelke DR. Pai DA, et al. Chromosoma. 2010 Feb;119(1):13-25. doi: 10.1007/s00412-009-0236-2. Epub 2009 Aug 30. Chromosoma. 2010. PMID: 19727792 Free PMC article. Review. - Nuclear pore complexes and regulation of gene expression.
Raices M, D'Angelo MA. Raices M, et al. Curr Opin Cell Biol. 2017 Jun;46:26-32. doi: 10.1016/j.ceb.2016.12.006. Epub 2017 Jan 11. Curr Opin Cell Biol. 2017. PMID: 28088069 Free PMC article. Review. - The yeast nuclear pore complex and transport through it.
Aitchison JD, Rout MP. Aitchison JD, et al. Genetics. 2012 Mar;190(3):855-83. doi: 10.1534/genetics.111.127803. Genetics. 2012. PMID: 22419078 Free PMC article. - Snf1/AMPK regulates Gcn5 occupancy, H3 acetylation and chromatin remodelling at S. cerevisiae ADY2 promoter.
Abate G, Bastonini E, Braun KA, Verdone L, Young ET, Caserta M. Abate G, et al. Biochim Biophys Acta. 2012 May;1819(5):419-27. doi: 10.1016/j.bbagrm.2012.01.009. Epub 2012 Jan 28. Biochim Biophys Acta. 2012. PMID: 22306658 Free PMC article.
References
- Barbara, K. E., T. M. Haley, K. A. Willis and G. M. Santangelo, 2007. The transcription factor Gcr1 stimulates cell growth by participating in nutrient-responsive gene expression on a global level. Mol. Genet. Genomics 277: 171–188. - PubMed
- Boukaba, A., E. I. Georgieva, F. A. Myers, A. W. Thorne, G. Lopez-Rodas et al., 2004. A short-range gradient of histone H3 acetylation and Tup1p redistribution at the promoter of the Saccharomyces cerevisiae SUC2 gene. J. Biol. Chem. 279: 7678–7684. - PubMed
- Cabal, G. G., A. Genovesio, S. Rodriguez-Navarro, C. Zimmer, O. Gadal et al., 2006. SAGA interacting factors confine sub-diffusion of transcribed genes to the nuclear envelope. Nature 441: 770–773. - PubMed
- Carlson, M., 1999. Glucose repression in yeast. Curr. Opin. Microbiol. 2: 202–207. - PubMed
Publication types
MeSH terms
Substances
LinkOut - more resources
Full Text Sources
Molecular Biology Databases


