DNA methylation dictates histone H3K4 methylation - PubMed (original) (raw)
DNA methylation dictates histone H3K4 methylation
Cindy Yen Okitsu et al. Mol Cell Biol. 2007 Apr.
Abstract
Histone lysine methylation and DNA methylation contribute to transcriptional regulation. We have previously shown that acetylated histones are associated with unmethylated DNA and are nearly absent from the methylated DNA regions by using patch-methylated stable episomes in human cells. The present study further demonstrates that DNA methylation immediately downstream from the transcription start site has a dramatic impact on transcription and that DNA methylation has a larger effect on transcription elongation than on initiation. We also show that dimethylated histone H3 at lysine 4 (H3K4me2) is depleted from regions with DNA methylation and that this effect is not linked to the transcriptional activity in the region. This effect is a local one and does not extend even 200 bp from the methylated DNA regions. Although depleted primarily from the methylated DNA regions, the presence of trimethylated histone H3 at lysine 4 (H3K4me3) may be affected by transcriptional activity as well. The data here suggest that DNA methylation at the junction of transcription initiation and elongation is most critical in transcription suppression and that this effect is mechanistically mediated through chromatin structure. The data also strongly support the model in which DNA methylation and not transcriptional activity dictates a closed chromatin structure, which excludes H3K4me2 and H3K4me3 in the region, as one of the pathways that safeguards the silent state of genes.
Figures
FIG. 1.
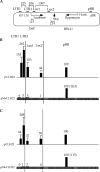
DNA methylation reduces the level of H3K4me2 and H3K4me3 on the stable episome in human cells. (A) Illustration of the episome. Locations of Q-PCR amplicons, LTR1, LTR3, Luc1, Luc2, and pBR, are marked by small bars above the diagram of the episome. The distances between the amplicons in the transcription units are indicated above the labels of the amplicons. The distance between Luc1 and the transcription start site and the distance between Luc2 and the stop codon are indicated under the labels of the regions. (B) Distribution of H3K4me2 on the unmethylated pCLH22 and the fully methylated pMeCLH22. The regions of methylation on the plasmid are depicted by thick horizontal lines hatched with short vertical lines. Long stretches of sequence lacking CpGs within the methylated region are represented by the lack of vertical lines within the thick horizontal line. Q-PCR was performed on the TCF, the no-Ab control, anti-H3K4me2, and anti-H3K4me3 ChIP samples with different TaqMan probe and primer sets. The %IP of regions LTR1, LTR3, Luc1, Luc2, Hyg, and Hyg5 was calculated as described in Materials and Methods and then normalized by the %IP of the pBR region from the same episome to derive the distribution of H3K4me2 on each episome. Histograms with accompanying values represent averages of the normalized %IP from five independent experiments, with standard deviations indicated by error bars. The number in the parentheses above the histogram in the pBR region is the %IP of the pBR region from pMeCLH22 normalized for the corresponding value from pCLH22. (C) Distribution of H3K4me3 on unmethylated pCLH22 and on fully methylated pMeCLH22. Histograms with accompanying values represent averages of the normalized %IP from five independent experiments, with standard deviations indicated by error bars. The number in the parentheses above the histogram in the pBR region is the value of %IP of the pBR region from pMeCLH22 normalized for the corresponding value from pCLH22.
FIG. 2.
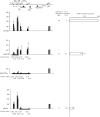
The position and length of DNA methylation impact gene activity and the levels of H3K4me2 and H3K4me3 on the episomes in human cells. Luciferase activities of the plasmids are shown at the right as luciferase activity relative to that of pCLH22. The luciferase expression was normalized for the amount of DNA harvested from transfected cells by Southern blot analysis. Bars represent the ranges of relative luciferase activity for the same episome from different transfections. The absolute readings of the luciferase activities range from 2 × 10⁶ to 2 × 10⁷ relative light units for pCLH22 from different experiments. At left is shown the distribution of H3K4me2 (black bars) and H3K4me3 (gray bars) on the episomes. The regions of methylation (horizontal lines with short vertical hatch marks) on the episome are shown, with the name of the episome on the left and the size of the methylated patch and the number of methylation sites listed to the right of each line. Histograms represent averages of the normalized %IP from five independent experiments, with standard deviations indicated by error bars. Error bars marked with asterisks indicate that one data point among the five experiments is two- to fourfold higher than the others. We chose to include all data points generated regardless of the clear outliers. A t test was carried out to test the hypothesis that the level of the modified histone is not significantly different between the patch-methylated episome and that of pCLH22. The P values of the t test are listed under each histogram.
FIG. 3.
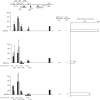
The level of H3K4me2 is correlated with DNA methylation, and the presence of H3K4me3 may be influenced by gene activity in addition to DNA methylation on the episomes in human cells. The luciferase activities of the episomes and the histograms representing the distribution of H3K4me2 and H3K4me3 are depicted as described in the legend to Fig. 2.
FIG. 4.
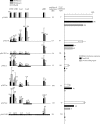
The presence of Pol II in the transcription unit is not correlated with the level of H3K4me2 or H3K4me3. The luciferase activities of the episomes are the same as those shown in Fig. 2 and 3. The histograms on the left represent H3K4me2 (black bars), H3K4me3 (gray bars), and Pol II (white bar) on each episome after being normalized to the %IP of the corresponding regions from pCLH22. The accompanying value on top of each bar represents the average of the normalized %IP from five independent ChIP experiments. The data for H3K4me2 and H3K4me3 are from the same experiments as described in the legends to Fig. 2 and 3 but normalized to the %IP of the corresponding regions from pCLH22 instead of the pBR region of the same episome. Error bars indicate standard deviations. No Pol II was detected in the LTR1 and pBR regions of any of the episomes. The histograms on the right show the relative luciferase expression and the total Pol II in the LTR3, Luc1, and Luc2 regions and the total Pol II in the Luc1 and Luc2 regions. Values accompanying the bars for total Pol II are the sums of the regions included in each bar.
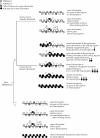
FIG. 5.
Gene suppression by DNA methylation through chromatin-mediated mechanisms. A DNA region that exceeds a threshold of DNA methylation size and density would have a closed chromatin structure, which excludes H3K4me2 and H3K4me3 and other histones that permit an open chromatin structure (within a defined boundary). In addition to other mechanisms for gene regulation, DNA methylation safeguards the silent status of the genes. P, promoter; C, coding region.
Similar articles
- Transcriptional activity affects the H3K4me3 level and distribution in the coding region.
Okitsu CY, Hsieh JC, Hsieh CL. Okitsu CY, et al. Mol Cell Biol. 2010 Jun;30(12):2933-46. doi: 10.1128/MCB.01478-09. Epub 2010 Apr 19. Mol Cell Biol. 2010. PMID: 20404096 Free PMC article. - DNA methylation has a local effect on transcription and histone acetylation.
Irvine RA, Lin IG, Hsieh CL. Irvine RA, et al. Mol Cell Biol. 2002 Oct;22(19):6689-96. doi: 10.1128/MCB.22.19.6689-6696.2002. Mol Cell Biol. 2002. PMID: 12215526 Free PMC article. - Differentially expressed genes are marked by histone 3 lysine 9 trimethylation in human cancer cells.
Wiencke JK, Zheng S, Morrison Z, Yeh RF. Wiencke JK, et al. Oncogene. 2008 Apr 10;27(17):2412-21. doi: 10.1038/sj.onc.1210895. Epub 2007 Oct 29. Oncogene. 2008. PMID: 17968314 - Understanding the interplay between CpG island-associated gene promoters and H3K4 methylation.
Hughes AL, Kelley JR, Klose RJ. Hughes AL, et al. Biochim Biophys Acta Gene Regul Mech. 2020 Aug;1863(8):194567. doi: 10.1016/j.bbagrm.2020.194567. Epub 2020 Apr 29. Biochim Biophys Acta Gene Regul Mech. 2020. PMID: 32360393 Free PMC article. Review. - Histone H3 lysine 4 di-methylation: a novel mark for transcriptional fidelity?
Pinskaya M, Morillon A. Pinskaya M, et al. Epigenetics. 2009 Jul 1;4(5):302-6. doi: 10.4161/epi.4.5.9369. Epub 2009 Jul 25. Epigenetics. 2009. PMID: 19633430 Review.
Cited by
- REPRODUCTIVE AGEING: Altered histone modification landscapes underpin defects in uterine stromal cell decidualization in aging females.
Woods L, Dean W, Hemberger M. Woods L, et al. Reproduction. 2024 Aug 2;168(3):e240171. doi: 10.1530/REP-24-0171. Print 2024 Sep 1. Reproduction. 2024. PMID: 38995736 Free PMC article. - ALS is imprinted in the chromatin accessibility of blood cells.
Kühlwein JK, Ruf WP, Kandler K, Witzel S, Lang C, Mulaw MA, Ekici AB, Weishaupt JH, Ludolph AC, Grozdanov V, Danzer KM. Kühlwein JK, et al. Cell Mol Life Sci. 2023 Apr 24;80(5):131. doi: 10.1007/s00018-023-04769-w. Cell Mol Life Sci. 2023. PMID: 37095391 Free PMC article. - Role of primary aging hallmarks in Alzheimer´s disease.
Zhao J, Huai J. Zhao J, et al. Theranostics. 2023 Jan 1;13(1):197-230. doi: 10.7150/thno.79535. eCollection 2023. Theranostics. 2023. PMID: 36593969 Free PMC article. Review. - Accurate Prediction of Epigenetic Multi-Targets with Graph Neural Network-Based Feature Extraction.
Wang Y, Qi J, Chen X. Wang Y, et al. Int J Mol Sci. 2022 Nov 1;23(21):13347. doi: 10.3390/ijms232113347. Int J Mol Sci. 2022. PMID: 36362128 Free PMC article. - Domain Structure of the Dnmt1, Dnmt3a, and Dnmt3b DNA Methyltransferases.
Tajima S, Suetake I, Takeshita K, Nakagawa A, Kimura H, Song J. Tajima S, et al. Adv Exp Med Biol. 2022;1389:45-68. doi: 10.1007/978-3-031-11454-0_3. Adv Exp Med Biol. 2022. PMID: 36350506 Free PMC article.
References
- Bernstein, B. E., M. Kamal, K. Lindblad-Toh, S. Bekiranov, D. K. Bailey, D. J. Huebert, S. McMahon, E. K. Karlsson, E. J. Kulbokas III, T. R. Gingeras, S. L. Schreiber, and E. S. Lander. 2005. Genomic maps and comparative analysis of histone modifications in human and mouse. Cell 120:169-181. - PubMed
- Braunstein, M., A. B. Rose, S. G. Holmes, C. D. Allis, and J. R. Broach. 1993. Transcriptional silencing in yeast is associated with reduced nucleosome acetylation. Genes Dev. 7:592-604. - PubMed
- Cedar, H. 1988. DNA methylation and gene activity. Cell 53:3-4. - PubMed
Publication types
MeSH terms
Substances
LinkOut - more resources
Full Text Sources
Other Literature Sources
