Identification of new noncoding RNAs in Listeria monocytogenes and prediction of mRNA targets - PubMed (original) (raw)
Identification of new noncoding RNAs in Listeria monocytogenes and prediction of mRNA targets
Pierre Mandin et al. Nucleic Acids Res. 2007.
Abstract
To identify noncoding RNAs (ncRNAs) in the pathogenic bacterium Listeria monocytogenes, we analyzed the intergenic regions (IGRs) of strain EGD-e by in silico-based approaches. Among the twelve ncRNAs found, nine are novel and specific to the Listeria genus, and two of these ncRNAs are expressed in a growth-dependent manner. Three of the ncRNAs are transcribed in opposite direction to overlapping open reading frames (ORFs), suggesting that they act as antisense on the corresponding mRNAs. The other ncRNA genes appear as single transcription units. One of them displays five repeats of 29 nucleotides. Five of these new ncRNAs are absent from the non-pathogenic species L. innocua, raising the possibility that they might be involved in virulence. To predict mRNA targets of the ncRNAs, we developed a computational method based on thermodynamic pairing energies and known ncRNA-mRNA hybrids. Three ncRNAs, including one of the putative antisense ncRNAs, were predicted to have more than one mRNA targets. Several of them were shown to bind efficiently to the ncRNAs suggesting that our in silico approach could be used as a general tool to search for mRNA targets of ncRNAs.
Figures
Figure 1.
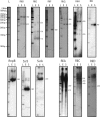
Detection of ncRNAs by northern blots. The name of the ncRNA is indicated on top of each panel. Total RNA was extracted from L. monocytogenes EGD-e strain grown to exponential (E) or stationary (S) phase in BHI at 37°C. Blots were performed with 12 µg of total RNA per lane and strand-specific probes, except for RliA, RliC and RliD where PCR products corresponding to the IGRs were used. ‘L’ indicates the DNA ladder used to estimate length. One lane of DNA molecular weight markers is shown for estimation of RNA size, since DNA and RNA run slightly differently on gel. Numbers on the right side of each panel indicate the estimated lengths of the transcripts in nucleotides. Exposure times were optimized for each panel and signal intensity does not indicate relative abundance between ncRNAs.
Figure 2.
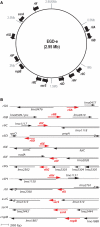
(A) Distribution of the rli genes along the L. monocytogenes genome of EGD-e strain. Nucleotide position, in Megabase (Mb), is indicated. (B) rli loci in L. monocytogenes. Red arrows represent the rli transcripts and their orientation; black arrows indicate the flanking ORFs. Maps are at scale, based on 5′ RACE mapping data, sizes estimated on gel and transcription terminator predictions. For RliD and RliF, transcription start sites have not be determined; positions and lengths are estimated. Document S4 provides information on sequences and the genomic location of rli genes.
Figure 3.
Sequence of rliB locus. In red, the _rliB_-transcribed sequence; arrows show the transcription orientations. The five RliB repeats (guuuuaguuacuuauUGugaaauRuaaau) are underlined and numbered with roman numerals. The transcription start site of rliB (+1) and a processing site (↓) mapped are shown. Deduced –10 and –35 hexamers of a putative RpoD-dependent promoter are boxed.
Figure 4.
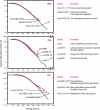
Prediction of mRNA targets for RliE, RliB and RliI. On the left: the pairing scores are computed as described in the text. In blue, the corresponding number of genes expected by chance, according to a null Markov model of length five. In red, the number of genes in EGD-e genome having a pairing strength ≥S, the value on the abscissas. Arrows indicate transcripts showing strongest pairings with the corresponding Rli sequence. On the right: list and function of genes whose mRNA are predicted targets for the corresponding ncRNA. *Two pairing regions are predicted between RliB and lmo2104-2105 mRNA.
Figure 5.
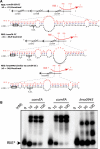
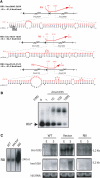
Hybrids between RliE and mRNA targets. (A) For each hybrid, the upper part shows the region of RliE (red) that pairs with the mRNA (black). Numbers in parenthesis indicate the first and the last bases of RliE involved in the pairing. The lower part shows the predicted pairings of RliE with the mRNA at the nucleotide level. Boxes indicate translation start codons, and S.D. the Shine–Dalgarno sequence is shown. (B) In vitro duplex formation between RliE and predicted mRNA targets indicated at the top of each panel. At the top of each lane, numbers indicate the concentration used (nM) of unlabeled RNA with <1 nM of labeled RliE. Unbound radioactive RliE* is indicated.
Figure 6.
Hybrids between RliI and mRNA targets. (A) For each hybrid, the upper part shows the region of RliI (red) that pairs with the mRNA (black). On the nucleotidic sequence, the translation start codon of lmo2659 is indicated by a grey box, the translation stop codon of lmo2660 by an open box. Data are otherwise presented as in Figure 5A. (B) Duplex formation between RliI and lmo1035 mRNA. Data are presented as in Figure 5B. (C) northern blots on 15 µg of total RNA extracted from L. monocytogenes EGD-e (WT), EGD-e harboring the empty vector pAT18 (vector) and pAT18 carrying the rliI gene (RliI) grown to exponential (E) or stationary (S) phase in BHI at 37°C. The RNA probed is indicated on the left of each panel. RliI is probed with a specific oligonucleotide, lmo1035 and lmo1036 transcripts were probed with PCR fragments. Estimated sizes of the transcripts are indicated on the right side of each panel. As loading control, gels were stained with EtBr before transfer to evaluate 16S rRNA levels (16S RNA).
Figure 7.
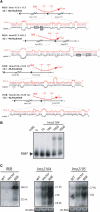
Hybrids between RliB and mRNA targets. (A) Hybrids between RliB (red) and predicted mRNA targets (black). Data are otherwise presented as in Figure 5A. (B) Duplex formation between RliB and lmo2104 mRNA. Data are presented as in Figure 5B. (C) northern blots on total RNA was extracted from bacteria grown to exponential phase in BHI at 37°C. Data are presented as in Figure 6C.
Similar articles
- Detection of very long antisense transcripts by whole transcriptome RNA-Seq analysis of Listeria monocytogenes by semiconductor sequencing technology.
Wehner S, Mannala GK, Qing X, Madhugiri R, Chakraborty T, Mraheil MA, Hain T, Marz M. Wehner S, et al. PLoS One. 2014 Oct 6;9(10):e108639. doi: 10.1371/journal.pone.0108639. eCollection 2014. PLoS One. 2014. PMID: 25286309 Free PMC article. - In Silico identification and characterization of mRNA-like noncoding transcripts in Medicago truncatula.
Wen J, Parker BJ, Weiller GF. Wen J, et al. In Silico Biol. 2007;7(4-5):485-505. In Silico Biol. 2007. PMID: 18391239 - A systematic search for new mammalian noncoding RNAs indicates little conserved intergenic transcription.
Babak T, Blencowe BJ, Hughes TR. Babak T, et al. BMC Genomics. 2005 Aug 5;6:104. doi: 10.1186/1471-2164-6-104. BMC Genomics. 2005. PMID: 16083503 Free PMC article. - The non-coding RNA world of the bacterial pathogen Listeria monocytogenes.
Mellin JR, Cossart P. Mellin JR, et al. RNA Biol. 2012 Apr;9(4):372-8. doi: 10.4161/rna.19235. Epub 2012 Feb 16. RNA Biol. 2012. PMID: 22336762 Review. - Identification and Role of Regulatory Non-Coding RNAs in Listeria monocytogenes.
Izar B, Mraheil MA, Hain T. Izar B, et al. Int J Mol Sci. 2011;12(8):5070-9. doi: 10.3390/ijms12085070. Epub 2011 Aug 10. Int J Mol Sci. 2011. PMID: 21954346 Free PMC article. Review.
Cited by
- CRISPR-Cas system positively regulates virulence of Salmonella enterica serovar Typhimurium.
Sharma N, Das A, Nair AV, Sethi P, Negi VD, Chakravortty D, Marathe SA. Sharma N, et al. Gut Pathog. 2024 Oct 26;16(1):63. doi: 10.1186/s13099-024-00653-5. Gut Pathog. 2024. PMID: 39462402 Free PMC article. - High density genomic surveillance and risk profiling of clinical Listeria monocytogenes subtypes in Germany.
Halbedel S, Wamp S, Lachmann R, Holzer A, Pietzka A, Ruppitsch W, Wilking H, Flieger A. Halbedel S, et al. Genome Med. 2024 Oct 7;16(1):115. doi: 10.1186/s13073-024-01389-2. Genome Med. 2024. PMID: 39375806 Free PMC article. - Role of Small Non-Coding RNA in Gram-Negative Bacteria: New Insights and Comprehensive Review of Mechanisms, Functions, and Potential Applications.
Khaledi M, Khatami M, Hemmati J, Bakhti S, Hoseini SA, Ghahramanpour H. Khaledi M, et al. Mol Biotechnol. 2024 Aug 17. doi: 10.1007/s12033-024-01248-w. Online ahead of print. Mol Biotechnol. 2024. PMID: 39153013 Review. - Complete genome sequence and comparative analysis of a Vibrio vulnificus strain isolated from a clinical patient.
Wu F, Zhang T, Wu Q, Li X, Zhang M, Luo X, Zhang Y, Lu R. Wu F, et al. Front Microbiol. 2023 Oct 31;14:1240835. doi: 10.3389/fmicb.2023.1240835. eCollection 2023. Front Microbiol. 2023. PMID: 38029170 Free PMC article. - Characterisation of the growth behaviour of Listeria monocytogenes in Listeria synthetic media.
Schulz LM, Konrath A, Rismondo J. Schulz LM, et al. Environ Microbiol Rep. 2023 Dec;15(6):669-683. doi: 10.1111/1758-2229.13183. Epub 2023 Oct 20. Environ Microbiol Rep. 2023. PMID: 37864319 Free PMC article.
References
- Storz G, Altuvia S, Wassarman KM. An abundance of RNA regulators. Annu. Rev. Biochem. 2005;74:199–217. - PubMed
- Repoila F, Majdalani N, Gottesman S. Small non-coding RNAs, co-ordinators of adaptation processes in Escherichia coli: the RpoS paradigm. Mol. Microbiol. 2003;48:855–861. - PubMed
- Wassarman KM. Small RNAs in bacteria: diverse regulators of gene expression in response to environmental changes. Cell. 2002;109:141–144. - PubMed
- Johansson J, Cossart P. RNA-mediated control of virulence gene expression in bacterial pathogens. Trends Microbiol. 2003;11:280–285. - PubMed
- Romby P, Vandenesch F, Wagner EG. The role of RNAs in the regulation of virulence-gene expression. Curr. Opin. Microbiol. 2006;9:229–236. - PubMed
Publication types
MeSH terms
Substances
LinkOut - more resources
Full Text Sources
Other Literature Sources
