Structural and functional basis of CXCL12 (stromal cell-derived factor-1 alpha) binding to heparin - PubMed (original) (raw)
Comparative Study
. 2007 Mar 30;282(13):10018-10027.
doi: 10.1074/jbc.M608796200. Epub 2007 Jan 29.
Affiliations
- PMID: 17264079
- PMCID: PMC3684283
- DOI: 10.1074/jbc.M608796200
Comparative Study
Structural and functional basis of CXCL12 (stromal cell-derived factor-1 alpha) binding to heparin
James W Murphy et al. J Biol Chem. 2007.
Abstract
CXCL12 (SDF-1alpha) and CXCR4 are critical for embryonic development and cellular migration in adults. These proteins are involved in HIV-1 infection, cancer metastasis, and WHIM disease. Sequestration and presentation of CXCL12 to CXCR4 by glycosaminoglycans (GAGs) is proposed to be important for receptor activation. Mutagenesis has identified CXCL12 residues that bind to heparin. However, the molecular details of this interaction have not yet been determined. Here we demonstrate that soluble heparin and heparan sulfate negatively affect CXCL12-mediated in vitro chemotaxis. We also show that a cluster of basic residues in the dimer interface is required for chemotaxis and is a target for inhibition by heparin. We present structural evidence for binding of an unsaturated heparin disaccharide to CXCL12 attained through solution NMR spectroscopy and x-ray crystallography. Increasing concentrations of the disaccharide altered the two-dimensional (1)H-(15)N-HSQC spectra of CXCL12, which identified two clusters of residues. One cluster corresponds to beta-strands in the dimer interface. The second includes the amino-terminal loop and the alpha-helix. In the x-ray structure two unsaturated disaccharides are present. One is in the dimer interface with direct contacts between residues His(25), Lys(27), and Arg(41) of CXCL12 and the heparin disaccharide. The second disaccharide contacts Ala(20), Arg(21), Asn(30), and Lys(64). This is the first x-ray structure of a CXC class chemokine in complex with glycosaminoglycans. Based on the observation of two heparin binding sites, we propose a mechanism in which GAGs bind around CXCL12 dimers as they sequester and present CXCL12 to CXCR4.
Figures
FIGURE 1
A, representation of the monomeric form of CXCL12. _β_-Strands are displayed as ribbons, helical regions are displayed as cylinders and loops, and random coil regions are displayed as a backbone trace. Each structural element is labeled. The two conserved disulfide bonds are displayed in black. The position of residues subjected to mutagenesis are indicated by labels. B, chemical structure of heparin. The oligomeric chemical structure of a fully sulfated heparin oligomer. A representative tetramer is shown with the polymer continuing through the terminal oxygens. Dark line segments indicate which bonds are cleaved by heparinases I and II to form the disaccharide I-S. C, heparin disaccharide I-S (_α_-4-deoxy-
l
-threo-hex-4-enopyranosyluronic acid-2-sulfate-(1→4)-
d
-glucosamine-N-sulfo-6-sulfate) as derived from heparin with a sulfate in each of the three R-group positions. Atom numbering follows IUPAC nomenclature for polysaccharide chains. A double bond absent in the heparin oligomer is formed between C4 and C5 of the uronic acid creating an unsaturated disaccharide.
FIGURE 2. Effects of GAGs on CXCL12-mediated chemotaxis
Chemotactic index is calculated as the number of cells migrating in the presence of CXCL12 with or without GAGs ÷ number of cells migrating in the absence of CXCL12. A, chemotaxis of heparan sulfate (0.1 to 100 _μ_g/ml) preincubated with CXCL12 (10 and 100 n
m
). B, chemotaxis of low and high molecular weight heparin (10 and 100 _μ_g/ml) were preincubated with CXCL12 (10 and 100 n
m
). Analysis of variance for data gives significance at p = 0.0001. In A, post hoc t tests give p ≤ 0.0008 for the CXCL12 activity at 10 and 100 n
m
versus background. These activities are inhibited by all concentrations of heparan sulfate tested and the effect is significant for 10 n
m
(p ≤ 0.009) and 100 n
m
CXCL12 (p ≤ 0.009). In B, post hoc t tests give p ≤ 0.0003 for the CXCL12 activity at 10 and 100 n
m
versus background. Both of these activities are significantly inhibited by all concentrations of heparin tested (10 n
m
CXCL12 is inhibited by 10 and 100 _μ_g/ml of low molecular weight heparin with p ≤ 0.0005 and by 10 and 100 _μ_g/ml of high molecular weight heparin with p = 0.0002 in both cases). 100 n
m
CXCL12 is inhibited by 10 and 100 _μ_g/ml of low molecular weight heparin with p ≤ 0.0003 and by 10 and 100 _μ_g/ml of high molecular weight heparin with p ≤ 0.0002.
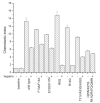
FIGURE 3. Effects of GAGs on mutant CXCL12-mediated chemotaxis
Six mutants of CXCL12 were compared with wild-type. Samples with heparin were treated with 100 _μ_g/ml of low molecular weight heparin. All proteins (wild-type and mutants) were tested at an optimal concentration for chemotaxis of CCRF-CEM cells (100 nM) with the exception of R8Q (1.0 μ
m
). The activities of all proteins are significantly higher versus background (p ≤ 0.001). The activities of all proteins (with the exception of the quintuple mutant; p = 0.02 for both with and without heparin) are significantly inhibited by treatment with 100 _μ_g/ml of low molecular weight heparin (p ≤ 0.005).
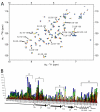
FIGURE 4. NMR spectroscopic studies of CXCL12 and heparin disaccharide interaction
A, NMR chemical shift changes induced by titration of heparin disaccharide I-S. 1H-15N-HSQC spectra of 2.0 m
m
15N-CXCL12 with 1.0, 2.0, 4.0, 8.0, and 12.0 m
m
heparin disaccharide I-S (orange, yellow, light green, green, and blue, respectively) are overlaid on the spectrum of 2.0 m
m
apo 15N-CXCL12 (red). Resonance peaks with the largest NMR chemical shift changes are labeled. Peak labels indicate peaks for the apo spectrum. B, absolute NMR chemical shift change of each residue for the disaccharide titration. Absolute NMR chemical shift change for each ratio are calculated as (((∣Nppmbound – Nppmapo∣) + (∣Hppmbound – Hppmapo∣ × 10))/2). 15N-CXCL12:heparin disaccharide I-S ratios as compared with 1:0 are colored red (1:0.5), orange (1:1), yellow (1:2), green (1:4), and blue (1:6). Changes in NMR chemical shifts for proline residues are reported as zero as they lack an amide proton. Regions of secondary structure are indicated below with block arrows representing β regions and zigzags representing helical regions. Two sets of residues (A/_A_’ and B/_B_’) that each form a cluster in the three-dimensional structure that are affected by titration of the disaccharide are indicated by brackets.
FIGURE 5. Crystal structure of the CXCL12:heparin disaccharide I-S complex
A, schematic representation of CXCL12 with chain A in cyan and chain B in red. Two heparin disaccharide I-S ligand molecules are shown as sticks, one within the dimer interface and one on the outer portion of monomer A. Image on the right is a 90° rotation around the y axis. B, the disaccharide bound structure of CXCL12 (blue) is overlaid with the unbound form (PDB code 1A15) (4) (cyan). The amino termini are removed for clarity. Both are shown as schematics representing the secondary structure elements and the two heparin disaccharide I-S molecules are shown as sticks. The image on the right is a 90° rotation around the y axis.
FIGURE 6. Heparin disaccharides I-S bound to CXCL12
A, the dimer interface from two views rotated 90° of CXCL12 showing the bound disaccharide with a composite omit 2_Fo_ – Fc electron density map around the ligand. Side chains interacting with I-S are shown as sticks. B, the diagram indicates hydrogen bonds (dashed lines) between the heparin disaccharide and the CXCL12 residues as calculated by the program LIGPLOT (55). C, outer portion of CXCL12 dimer from two views rotated 90° showing the second disaccharide with the corresponding composite omit 2_Fo_ – Fc electron density map. D, interactions between the second heparin disaccharide and CXCL12.
FIGURE 7. An overlay of the results from the backbone chemical shifts changes upon heparin disaccharide addition on the crystal structure of the CXCL12-heparin disaccharide I-S complex
A, calculated Connolly surface of CXCL12 with heparin disaccharide ligands displayed as sticks. Greater chemical shift changes are displayed as increasing red intensity. Chemical shift changes are measured between apo and a 1:2 CXCL12:heparin disaccharide I-S molar ratio. Light gray indicates prolines for which chemical shift data are not available. B, the carbon backbones are displayed as schematics indicating the secondary structure and colored as in A. The figures on the right are rotated 90° around the y axis.
Similar articles
- Heparin oligosaccharides inhibit chemokine (CXC motif) ligand 12 (CXCL12) cardioprotection by binding orthogonal to the dimerization interface, promoting oligomerization, and competing with the chemokine (CXC motif) receptor 4 (CXCR4) N terminus.
Ziarek JJ, Veldkamp CT, Zhang F, Murray NJ, Kartz GA, Liang X, Su J, Baker JE, Linhardt RJ, Volkman BF. Ziarek JJ, et al. J Biol Chem. 2013 Jan 4;288(1):737-46. doi: 10.1074/jbc.M112.394064. Epub 2012 Nov 12. J Biol Chem. 2013. PMID: 23148226 Free PMC article. - Characterization of the stromal cell-derived factor-1alpha-heparin complex.
Sadir R, Baleux F, Grosdidier A, Imberty A, Lortat-Jacob H. Sadir R, et al. J Biol Chem. 2001 Mar 16;276(11):8288-96. doi: 10.1074/jbc.M008110200. Epub 2000 Nov 21. J Biol Chem. 2001. PMID: 11087743 - The monomer-dimer equilibrium of stromal cell-derived factor-1 (CXCL 12) is altered by pH, phosphate, sulfate, and heparin.
Veldkamp CT, Peterson FC, Pelzek AJ, Volkman BF. Veldkamp CT, et al. Protein Sci. 2005 Apr;14(4):1071-81. doi: 10.1110/ps.041219505. Epub 2005 Mar 1. Protein Sci. 2005. PMID: 15741341 Free PMC article. - CXCL14 antagonizes the CXCL12-CXCR4 signaling axis.
Hara T, Tanegashima K. Hara T, et al. Biomol Concepts. 2014 May;5(2):167-73. doi: 10.1515/bmc-2014-0007. Biomol Concepts. 2014. PMID: 25372750 Review. - CXCR4: a key receptor in the crosstalk between tumor cells and their microenvironment.
Burger JA, Kipps TJ. Burger JA, et al. Blood. 2006 Mar 1;107(5):1761-7. doi: 10.1182/blood-2005-08-3182. Epub 2005 Nov 3. Blood. 2006. PMID: 16269611 Review.
Cited by
- Heparin Mimetics and Their Impact on Extracellular Matrix Protein Assemblies.
Heide F, Koch M, Stetefeld J. Heide F, et al. Pharmaceuticals (Basel). 2023 Mar 22;16(3):471. doi: 10.3390/ph16030471. Pharmaceuticals (Basel). 2023. PMID: 36986571 Free PMC article. - Fluorinated triphenylphosphonium analogs improve cell selectivity and in vivo detection of mito-metformin.
AbuEid M, Keyes RF, McAllister D, Peterson F, Kadamberi IP, Sprague DJ, Chaluvally-Raghavan P, Smith BC, Dwinell MB. AbuEid M, et al. iScience. 2022 Nov 26;25(12):105670. doi: 10.1016/j.isci.2022.105670. eCollection 2022 Dec 22. iScience. 2022. PMID: 36567718 Free PMC article. - A glycan-based approach to cell characterization and isolation: Hematopoiesis as a paradigm.
Piszczatowski RT, Schwenger E, Sundaravel S, Stein CM, Liu Y, Stanley P, Verma A, Zheng D, Seidel RD, Almo SC, Townley RA, Bülow HE, Steidl U. Piszczatowski RT, et al. J Exp Med. 2022 Nov 7;219(11):e20212552. doi: 10.1084/jem.20212552. Epub 2022 Sep 6. J Exp Med. 2022. PMID: 36066492 Free PMC article. - Macrophage-Specific IGF-1 Overexpression Reduces CXCL12 Chemokine Levels and Suppresses Atherosclerotic Burden in Apoe-Deficient Mice.
Snarski P, Sukhanov S, Yoshida T, Higashi Y, Danchuk S, Chandrasekar B, Tian D, Rivera-Lopez V, Delafontaine P. Snarski P, et al. Arterioscler Thromb Vasc Biol. 2022 Feb;42(2):113-126. doi: 10.1161/ATVBAHA.121.316090. Epub 2021 Dec 2. Arterioscler Thromb Vasc Biol. 2022. PMID: 34852642 Free PMC article. - The marriage of chemokines and galectins as functional heterodimers.
von Hundelshausen P, Wichapong K, Gabius HJ, Mayo KH. von Hundelshausen P, et al. Cell Mol Life Sci. 2021 Dec;78(24):8073-8095. doi: 10.1007/s00018-021-04010-6. Epub 2021 Nov 12. Cell Mol Life Sci. 2021. PMID: 34767039 Free PMC article. Review.
References
- Fernandez EJ, Lolis E. Annu. Rev. Pharmacol. Toxicol. 2002;42:469–499. - PubMed
- Lapidot T, Petit I. Exp. Hematol. 2002;30:973–981. - PubMed
- Bleul CC, Farzan M, Choe H, Parolin C, Clark-Lewis I, Sodroski J, Springer TA. Nature. 1996;382:829–833. - PubMed
- Ohnishi Y, Senda T, Nandhagopal N, Sugimoto K, Shioda T, Nagal Y, Mitsui Y. J. Interferon Cytokine Res. 2000;20:691–700. - PubMed
Publication types
MeSH terms
Substances
LinkOut - more resources
Full Text Sources
Other Literature Sources
Medical
Molecular Biology Databases


