Assessment of nitric oxide signals by triiodide chemiluminescence - PubMed (original) (raw)
Assessment of nitric oxide signals by triiodide chemiluminescence
Alfred Hausladen et al. Proc Natl Acad Sci U S A. 2007.
Abstract
Nitric oxide (NO) bioactivity is mainly conveyed through reactions with iron and thiols, furnishing iron nitrosyls and S-nitrosothiols with wide-ranging stabilities and reactivities. Triiodide chemiluminescence methodology has been popularized as uniquely capable of quantifying these species together with NO byproducts, such as nitrite and nitrosamines. Studies with triiodide, however, have challenged basic ideas of NO biochemistry. The assay, which involves addition of multiple reagents whose chemistry is not fully understood, thus requires extensive validation: Few protein standards have in fact been characterized; NO mass balance in biological mixtures has not been verified; and recovery of species that span the range of NO-group reactivities has not been assessed. Here we report on the performance of the triiodide assay vs. photolysis chemiluminescence in side-by-side assays of multiple nitrosylated standards of varied reactivities and in assays of endogenous Fe- and S-nitrosylated hemoglobin. Although the photolysis method consistently gives quantitative recoveries, the yields by triiodide are variable and generally low (approaching zero with some standards and endogenous samples). Moreover, in triiodide, added chemical reagents, changes in sample pH, and altered ionic composition result in decreased recoveries and misidentification of NO species. We further show that triiodide, rather than directly and exclusively producing NO, also produces the highly potent nitrosating agent, nitrosyliodide. Overall, we find that the triiodide assay is strongly influenced by sample composition and reactivity and does not reliably identify, quantify, or differentiate NO species in complex biological mixtures.
Conflict of interest statement
The authors declare no conflict of interest.
Figures
Fig. 1.
Comparison of the sensitivity and specificity of the photolysis and triiodide assays for paired samples of FeNO compounds. (A) SNP, a model Fe(III)NO compound, at the indicated concentrations, with GSNO shown as a standard. AU, arbitrary units. Note that, in this and subsequent figures, the magnitudes of signals generated by photolysis and by triiodide, expressed as arbitrary units, cannot be compared directly (the two methods exhibit equivalent sensitivity for NO). (B) A sequence of injections of a GSNO standard (500 nM), a Fe(II)NO Hb solution {1 mM Hb[Fe(II)] containing 500 nM Hb[Fe(II)NO]}, and a repetition of the GSNO standard after Hb. The repeat injection of GSNO in the triiodide gave a distorted, diminished signal. (C) Hb Fe(III)NO/Fe(II)NO+ equivalent (SNO precursor) (37). Photolysis accurately measures the transient formation of a Fe(III)NO/Fe(II)NO+ equivalent generated from 1 μM nitrite/1 mM deoxyHb (×5–10 s), with scant response from nitrite alone (1 μM GSNO shown for comparison). In contrast, nitrite produces a prominent signal in the triiodide assay, whereas its signal in the presence of 250 μM deoxyHb is markedly attenuated. Furthermore, the signal generated by such samples can be variable and difficult to quantify (the line shape of a second sample, which is magnified for clarity, hampers reliable integration).
Fig. 2.
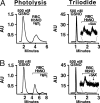
Comparison of photolysis and triiodide assays for endogenous nitrosyl Hb and _S_-nitroso Hb. (A) Deoxygenated venous blood FeNO Hb. Injections of 100 μM deoxyHb (RBC lysate after clarification and desalting) with or without Hg pretreatment gave a strong signal by photolysis vs. a greatly diminished signal in triiodide. A GSNO standard is shown for comparison. (Inset) Triiodide signal magnified. (B) Oxygenated blood SNO-Hb. Injections of 100 μM oxyHb (RBC lysate after clarification and desalting) yielded a strong signal by photolysis that is largely eliminated by Hg, whereas the signal is barely detected in triiodide. (Inset) The very small triiodide signal is eliminated by SAA.
Fig. 3.
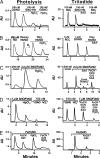
Comparison of the sensitivity and specificity of the photolysis and triiodide assays for SNO-Hb compounds. (A) SNO-Hb (100 nM SNO/100 μM Hb) synthesized by brief exposure to excess _S_-nitrosocysteine is largely eliminated by Hg in the photolysis assay. A 100 nM GSNO standard is similarly quenched by Hg. The same SNO-Hb sample is quenched by SAA in triiodide, ostensibly identifying it as nitrite. Nitrite is shown as a standard. (B) An SNO/FeNO valency hybrid synthesized from native HbA (0.4 mM heme) by using NO solution (method 1) contains 0.65 μM NO (≈0.4 μM SNO), as measured by photolysis. Note that native HbA contains ≈50 nM NO. Shown in sequence are the following: amount of NO added (0.6 μM), amount of NO bound to deoxyHb after NO addition (Deoxy HbNO), and amount NO bound to Hb after oxygenation with or without Hg (Oxy HbNO). The same oxyHbNO sample gives 100% yield by triiodide (≈0.65 μM NO); however, the signal is eliminated with SAA, to which both FeNO and SNO are reportedly impervious. (C) An SNO/FeNO valency hybrid derived from NO solution by using method 2 contains 2.2 μM NO (1.0 μM SNO, 1.2 μM FeNO, and 1 mM heme), as measured by photolysis. The sample is underestimated (1.6 μM NO) and misidentified by triiodide as nitrite (eliminated by SAA) and as FeNO (eliminated by FeCN/G25) and SNO (residual). (D) An SNO/FeNO valency hybrid measured by photolysis (5.0 μM SNO, 2 μM FeNO, and 1 mM heme). The sample was pretreated with FeCN and KCN to obtain an SNO value of 480 nM by triiodide (a yield of <10%). (E) Exposure of tetranitrosyl Hb (1 μM NO) to FeCN leads to the production of SNO-Hb (≈500 nM) as shown by photolysis, whereas the sample is identified as FeNO by triiodide.
Fig. 4.
Instability of protein SNOs under conditions of the triiodide assay. (A) Spectrophotometric analysis reveals GSNO degradation in the presence of KCN and NEM. GSNO (1 mM) is stable when incubated in PBS with 0.1 mM DTPA (□), PBS/DTPA and 5 mM NEM, or PBS/DTPA and 200 mM KCN (identical trend lines; ▽). However, the combination of NEM and KCN rapidly degrades GSNO (○). (B and C) SNO-caspase (B) and SNO-Hb (in the presence of 1 mM glutathione) (C) degrade with decreases in pH. (D) Tissue transglutaminase (tTG) SNO content decreases after a change in Ca2+ concentration.
Fig. 5.
The triiodide assay produces potent nitrosating species and precipitates proteins: impact on NO yield. (A) GSNO and BSA were assayed by triiodide (I3−) individually (stacked bar) or as a mixture of GSNO/BSA (open bar); GSNO/BSA is consistently lower. (B) A purple gas is formed when nitrite is added to triiodide (left tube), and BSA forms a colored precipitate when added with nitrite/triiodide (middle tube), whereas BSA alone remains soluble in the reagent (right tube). (C) Spectrum of BSA precipitate redissolved in 1 N NaOH (dashed line) vs. BSA/triiodide without nitrite subjected to the same protocol (solid line). (D) NOI signature in the gas phase above the triiodide reagent after the addition of nitrite. I2 gives the broad absorption at 530 nm and contributes to the low wavelength edge (purple line), whereas the peaks at ≈250 and ≈390 are characteristic of NOI (blue line). The green line with a maximum at 230 nm corresponds to NO.
Similar articles
- Detection of human red blood cell-bound nitric oxide.
Rogers SC, Khalatbari A, Gapper PW, Frenneaux MP, James PE. Rogers SC, et al. J Biol Chem. 2005 Jul 22;280(29):26720-8. doi: 10.1074/jbc.M501179200. Epub 2005 May 6. J Biol Chem. 2005. PMID: 15879596 - Quantification of Total N-Nitrosamine Concentrations in Aqueous Samples via UV-Photolysis and Chemiluminescence Detection of Nitric Oxide.
Breider F, von Gunten U. Breider F, et al. Anal Chem. 2017 Feb 7;89(3):1574-1582. doi: 10.1021/acs.analchem.6b03595. Epub 2017 Jan 6. Anal Chem. 2017. PMID: 27989108 - Detection of S-nitrosothiols and other nitric oxide derivatives by photolysis-chemiluminescence spectrometry.
Alpert C, Ramdev N, George D, Loscalzo J. Alpert C, et al. Anal Biochem. 1997 Feb 1;245(1):1-7. doi: 10.1006/abio.1996.9947. Anal Biochem. 1997. PMID: 9025962 - S-nitrosothiol assays that avoid the use of iodine.
Palmer LA, Gaston B. Palmer LA, et al. Methods Enzymol. 2008;440:157-76. doi: 10.1016/S0076-6879(07)00809-9. Methods Enzymol. 2008. PMID: 18423216 Review. - Nitric oxide detection methods in vitro and in vivo.
Goshi E, Zhou G, He Q. Goshi E, et al. Med Gas Res. 2019 Oct-Dec;9(4):192-207. doi: 10.4103/2045-9912.273957. Med Gas Res. 2019. PMID: 31898604 Free PMC article. Review.
Cited by
- Red Blood Cell-Mediated S-Nitrosohemoglobin-Dependent Vasodilation: Lessons Learned from a β-Globin Cys93 Knock-In Mouse.
Premont RT, Reynolds JD, Zhang R, Stamler JS. Premont RT, et al. Antioxid Redox Signal. 2021 Apr 20;34(12):936-961. doi: 10.1089/ars.2020.8153. Epub 2020 Jul 23. Antioxid Redox Signal. 2021. PMID: 32597195 Free PMC article. Review. - Assays for S-nitrosothiols and S-nitrosylated proteins and mechanistic insights into cardioprotection.
Hess DT, Foster MW, Stamler JS. Hess DT, et al. Circulation. 2009 Jul 21;120(3):190-3. doi: 10.1161/CIRCULATIONAHA.109.876607. Epub 2009 Jul 6. Circulation. 2009. PMID: 19581490 Free PMC article. No abstract available. - Methodologies for the characterization, identification and quantification of S-nitrosylated proteins.
Foster MW. Foster MW. Biochim Biophys Acta. 2012 Jun;1820(6):675-83. doi: 10.1016/j.bbagen.2011.03.013. Epub 2011 Apr 5. Biochim Biophys Acta. 2012. PMID: 21440604 Free PMC article. Review. - Pharmacologic Targeting of Red Blood Cells to Improve Tissue Oxygenation.
Reynolds JD, Jenkins T, Matto F, Nazemian R, Farhan O, Morris N, Longphre JM, Hess DT, Moon RE, Piantadosi CA, Stamler JS. Reynolds JD, et al. Clin Pharmacol Ther. 2018 Sep;104(3):553-563. doi: 10.1002/cpt.979. Epub 2018 Jan 17. Clin Pharmacol Ther. 2018. PMID: 29238951 Free PMC article. Clinical Trial. - Comparative Evaluation of Chemical and Photolytic Denitrosation Methods for Chemiluminescence Detection of Total _N_-Nitrosamines in Wastewater Samples.
Pu C, Zeng T. Pu C, et al. Environ Sci Technol. 2023 May 16;57(19):7526-7536. doi: 10.1021/acs.est.2c09769. Epub 2023 May 4. Environ Sci Technol. 2023. PMID: 37140470 Free PMC article.
References
- Hess DT, Matsumoto A, Kim SO, Marshall HE, Stamler JS. Nat Rev Mol Cell Biol. 2005;6:150–166. - PubMed
- Stamler JS, Lamas S, Fang FC. Cell. 2001;106:675–683. - PubMed
- Foster MW, McMahon TJ, Stamler JS. Trends Mol Med. 2003;9:160–168. - PubMed
- Stamler JS. Circ Res. 2004;94:414–417. - PubMed
- Singel DJ, Stamler JS. Annu Rev Physiol. 2005;67:99–145. - PubMed
Publication types
MeSH terms
Substances
Grants and funding
- U19 ES012496/ES/NIEHS NIH HHS/United States
- 1P01-HL75443/HL/NHLBI NIH HHS/United States
- P01 HL075443/HL/NHLBI NIH HHS/United States
- 419-ES012496/ES/NIEHS NIH HHS/United States
- 5P01-HL424444/HL/NHLBI NIH HHS/United States
LinkOut - more resources
Full Text Sources


