Global and regional effects of type 2 diabetes on brain tissue volumes and cerebral vasoreactivity - PubMed (original) (raw)
Global and regional effects of type 2 diabetes on brain tissue volumes and cerebral vasoreactivity
David Last et al. Diabetes Care. 2007 May.
Abstract
Objective: The aim of this study was to evaluate the regional effects of type 2 diabetes and associated conditions on cerebral tissue volumes and cerebral blood flow (CBF) regulation.
Research design and methods: CBF was examined in 26 diabetic (aged 61.6 +/- 6.6 years) and 25 control (aged 60.4 +/- 8.6 years) subjects using continuous arterial spin labeling (CASL) imaging during baseline, hyperventilation, and CO2 rebreathing. Regional gray and white matter, cerebrospinal fluid (CSF), and white matter hyperintensity (WMH) volumes were measured on a T1-weighted inversion recovery fast-gradient echo and a fluid attenuation inversion recovery magnetic resonance imaging at 3 Tesla.
Results: The diabetic group had smaller global white (P = 0.006) and gray (P = 0.001) matter and larger CSF (36.3%, P < 0.0001) volumes than the control group. Regional differences were observed for white matter (-13.1%, P = 0.0008) and CSF (36.3%, P < 0.0001) in the frontal region, for CSF (20.9%, P = 0.0002) in the temporal region, and for gray matter (-3.0%, P = 0.04) and CSF (17.6%, P = 0.01) in the parieto-occipital region. Baseline regional CBF (P = 0.006) and CO2 reactivity (P = 0.005) were reduced in the diabetic group. Hypoperfusion in the frontal region was associated with gray matter atrophy (P < 0.0001). Higher A1C was associated with lower CBF (P < 0.0001) and greater CSF (P = 0.002) within the temporal region.
Conclusions: Type 2 diabetes is associated with cortical and subcortical atrophy involving several brain regions and with diminished regional cerebral perfusion and vasoreactivity. Uncontrolled diabetes may further contribute to hypoperfusion and atrophy. Diabetic metabolic disturbance and blood flow dysregulation that affects preferentially frontal and temporal regions may have implications for cognition and balance in elderly subjects with diabetes.
Figures
Figure 1
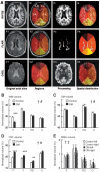
A: Brain regions partitioning method. The first column on the left presents an original axial slice at the level of the ventricles for the IR-FGE (I1), the FLAIR image (F1), and for the CASL acquisition (T2 reference image, C1). The second column illustrates the six regions computed on the images showed on column 1: the left (L) and right (R) side of the frontal (F), parieto-occipital (PO), and temporal (T) regions (as indicated on I2). The last two columns illustrate the processing/reconstruction performed on the images shown in column 1 and the assessment of spatial distribution for the computed parameters. The regions were applied to the segmented IR-FGE image (I3) to assess the regional distribution of gray matter, white matter, and CSF volumes (I4) to the segmented FLAIR image (F3) to assess WMH volume distribution (F4). After reconstruction of the (CBF) maps (an example CO2 rebreathing map is shown on C3), CBF values were averaged over each region (C4), allowing CO2 reactivity computation for each region. White matter (B), gray matter (C), CSF (D), and WMH (E) volumes in the frontal (F), temporal (T), parieto-occipital (PO), and cortical (C) regions for both groups, normalized for region volume in control and diabetic (DM) groups (means ± SE). †Between-region comparisons for both groups (P < 0.0001). ‡Between-hemisphere comparisons for both groups (P = 0.004). #Between-group comparisons over all regions (P ≤ 0.006). ***Between-group comparisons within regions (P ≤ 0.0008). *P = 0.04; **P = 0.01.
Figure 2
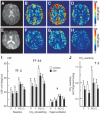
CBF maps reconstructed from the CASL acquisition for a control subject (A–D) and a diabetic (DM) subject (E–G). A and E: An axial slice of a T2 reference image at the level of the ventricles used for the CBF map reconstruction. B and F: CBF maps at baseline. C and G: CO2 rebreathing. D and H: Hyperventilation. The perfusion ranges from 0 to 125 ml · 100 g−1 · min−1 on all CBF maps. CBF during the first baseline, the CO2 rebreathing, and hyperventilation periods (I) and the calculated CO2 reactivity (J) in the frontal (F), temporal (T), parieto-occipital (PO), and cortical (C) regions in control (□) and diabetic (DM;▪) groups (means ± SE). ††Between-region comparisons for both groups (P < 0.0001). †P = 0.001 ≤ P ≤ 0.006. ##Between-group comparisons over all regions (P = 0.001). #P = 0.005 ≤ P ≤ 0.006.
Similar articles
- Structural and physiological MRI correlates of occult cerebrovascular disease in late-onset epilepsy.
Hanby MF, Al-Bachari S, Makin F, Vidyasagar R, Parkes LM, Emsley HC. Hanby MF, et al. Neuroimage Clin. 2015 Aug 20;9:128-33. doi: 10.1016/j.nicl.2015.07.016. eCollection 2015. Neuroimage Clin. 2015. PMID: 26413475 Free PMC article. - Combined effects of type 2 diabetes and hypertension associated with cortical thinning and impaired cerebrovascular reactivity relative to hypertension alone in older adults.
Tchistiakova E, Anderson ND, Greenwood CE, MacIntosh BJ. Tchistiakova E, et al. Neuroimage Clin. 2014 Jun 5;5:36-41. doi: 10.1016/j.nicl.2014.05.020. eCollection 2014. Neuroimage Clin. 2014. PMID: 24967157 Free PMC article. - Arterial spin labelling reveals prolonged arterial arrival time in idiopathic Parkinson's disease.
Al-Bachari S, Parkes LM, Vidyasagar R, Hanby MF, Tharaken V, Leroi I, Emsley HC. Al-Bachari S, et al. Neuroimage Clin. 2014 Aug 1;6:1-8. doi: 10.1016/j.nicl.2014.07.014. eCollection 2014. Neuroimage Clin. 2014. PMID: 25379411 Free PMC article. - Regional cerebral blood flow, white matter abnormalities, and cerebrospinal fluid hydrodynamics in patients with idiopathic adult hydrocephalus syndrome.
Kristensen B, Malm J, Fagerland M, Hietala SO, Johansson B, Ekstedt J, Karlsson T. Kristensen B, et al. J Neurol Neurosurg Psychiatry. 1996 Mar;60(3):282-8. doi: 10.1136/jnnp.60.3.282. J Neurol Neurosurg Psychiatry. 1996. PMID: 8609504 Free PMC article. Review. - Cerebral perfusion alterations in type 2 diabetes mellitus - a systematic review.
Wang Y, Sun L, He G, Gang X, Zhao X, Wang G, Ning G. Wang Y, et al. Front Neuroendocrinol. 2021 Jul;62:100916. doi: 10.1016/j.yfrne.2021.100916. Epub 2021 May 3. Front Neuroendocrinol. 2021. PMID: 33957174 Review.
Cited by
- Impaired cerebral autoregulation is associated with brain atrophy and worse functional status in chronic ischemic stroke.
Aoi MC, Hu K, Lo MT, Selim M, Olufsen MS, Novak V. Aoi MC, et al. PLoS One. 2012;7(10):e46794. doi: 10.1371/journal.pone.0046794. Epub 2012 Oct 11. PLoS One. 2012. PMID: 23071639 Free PMC article. - Influence of type 2 diabetes on brain volumes and changes in brain volumes: results from the Women's Health Initiative Magnetic Resonance Imaging studies.
Espeland MA, Bryan RN, Goveas JS, Robinson JG, Siddiqui MS, Liu S, Hogan PE, Casanova R, Coker LH, Yaffe K, Masaki K, Rossom R, Resnick SM; WHIMS-MRI Study Group. Espeland MA, et al. Diabetes Care. 2013 Jan;36(1):90-7. doi: 10.2337/dc12-0555. Epub 2012 Aug 29. Diabetes Care. 2013. PMID: 22933440 Free PMC article. - Memory advancement by intranasal insulin in type 2 diabetes (MemAID) randomized controlled clinical trial: Design, methods and rationale.
Galindo-Mendez B, Trevino JA, McGlinchey R, Fortier C, Lioutas V, Novak P, Mantzoros CS, Ngo L, Novak V. Galindo-Mendez B, et al. Contemp Clin Trials. 2020 Feb;89:105934. doi: 10.1016/j.cct.2020.105934. Epub 2020 Jan 7. Contemp Clin Trials. 2020. PMID: 31923471 Free PMC article. - Altered Cerebral Vasoreactivity on Transcranial Color-Coded Sonography Related to Akinetic-Rigid Phenotype of Parkinson's Disease: Interim Analysis of a Cross-Sectional Study.
Brisson RT, Fernandes RCL, Arruda JFL, Rocha TCCDSM, Santos NGD, Silva LD, de Lima MASD, de Rosso ALZ. Brisson RT, et al. Brain Sci. 2023 Apr 24;13(5):709. doi: 10.3390/brainsci13050709. Brain Sci. 2023. PMID: 37239181 Free PMC article. - Cognitive decline in metabolic syndrome is linked to microstructural white matter abnormalities.
Alfaro FJ, Lioutas VA, Pimentel DA, Chung CC, Bedoya F, Yoo WK, Novak V. Alfaro FJ, et al. J Neurol. 2016 Dec;263(12):2505-2514. doi: 10.1007/s00415-016-8292-z. Epub 2016 Oct 11. J Neurol. 2016. PMID: 27730376 Free PMC article.
References
- U.S. Department of Health and Human Services, Centers for Disease Control and Prevention . National Diabetes Fact Sheet: General Information and National Estimates on Diabetes in the United States, 2003. Revised ed. Centers for Disease Control and Prevention; Atlanta, GA: 2004.
- Trauernicht AK, Sun H, Patel KP, Mayhan WG. Enalapril prevents impaired nitric oxide synthase-dependent dilatation of cerebral arterioles in diabetic rats. Stroke. 2003;34:2698–2703. - PubMed
- Makimattila S, Malmberg-Ceder K, Hakkinen AM, Vuori K, Salonen O, Summanen P, Yki-Jarvinen H, Kaste M, Heikkinen S, Lundbom N, Roine RO. Brain metabolic alterations in patients with type 1 diabetes-hyperglycemia-induced injury. J Cereb Blood Flow Metab. 2004;24:1393–1399. - PubMed
- Vazquez LA, Amado JA, Garcia-Unzueta MT, Quirce R, Jimenez-Bonilla JF, Pazos F, Pesquera C, Carril JM. Decreased plasma endothelin-1 levels in asymptomatic type I diabetic patients with regional cerebral hypoperfusion assessed by Spect. J Diabetes Complications. 1999;13:325–331. - PubMed
- Jimenez-Bonilla JF, Carril JM, Quirce R, Gomez-Barquin R, Amado JA, Gutierrez-Mendiguchia C. Assessment of cerebral blood flow in diabetic patients with no clinical history of neurological disease. Nucl Med Commun. 1996;17:790–794. - PubMed
Publication types
MeSH terms
Substances
Grants and funding
- 1R01-NS045745-01A21/NS/NINDS NIH HHS/United States
- M01 RR001032-316142/RR/NCRR NIH HHS/United States
- R01 NS045745-04/NS/NINDS NIH HHS/United States
- P01 AG004390/AG/NIA NIH HHS/United States
- M01 RR001032-316097/RR/NCRR NIH HHS/United States
- M01 RR001032/RR/NCRR NIH HHS/United States
- M01-RR01032/RR/NCRR NIH HHS/United States
- P60 AG008812/AG/NIA NIH HHS/United States
- 2P60 AG08812/AG/NIA NIH HHS/United States
- AG004390/AG/NIA NIH HHS/United States
- M01 RR001032-30A10856/RR/NCRR NIH HHS/United States
- R01 NS045745/NS/NINDS NIH HHS/United States
LinkOut - more resources
Full Text Sources
Medical

