Distinct C/EBPalpha motifs regulate lipogenic and gluconeogenic gene expression in vivo - PubMed (original) (raw)
Comparative Study
. 2007 Feb 21;26(4):1081-93.
doi: 10.1038/sj.emboj.7601563. Epub 2007 Feb 8.
Affiliations
- PMID: 17290224
- PMCID: PMC1852842
- DOI: 10.1038/sj.emboj.7601563
Comparative Study
Distinct C/EBPalpha motifs regulate lipogenic and gluconeogenic gene expression in vivo
Thomas A Pedersen et al. EMBO J. 2007.
Abstract
The C/EBPalpha transcription factor regulates hepatic nitrogen, glucose, lipid and iron metabolism. However, how it is able to independently control these processes is not known. Here, we use mouse knock-in mutagenesis to identify C/EBPalpha domains that specifically regulate hepatic gluconeogenesis and lipogenesis. In vivo deletion of a proline-histidine rich domain (PHR), dephosphorylated at S193 by insulin signaling, dysregulated genes involved in the generation of acetyl-CoA and NADPH for triglyceride synthesis and led to increased hepatic lipogenesis. These promoters bound SREBP-1 as well as C/EBPalpha, and the PHR was required for C/EBPalpha-SREBP transcriptional synergy. In contrast, the highly conserved C/EBPalpha CR4 domain was found to undergo liver-specific dephosphorylation of residues T222 and T226 upon fasting, and alanine mutation of these residues upregulated the hepatic expression of the gluconeogenic G6Pase and PEPCK mRNAs, but not PGC-1alpha, leading to glucose intolerance. Our results show that pathway-specific metabolic regulation can be achieved through a single transcription factor containing context-sensitive regulatory domains, and indicate C/EBPalpha phosphorylation as a PGC-1alpha-independent mechanism for regulating hepatic gluconeogenesis.
Figures
Figure 1
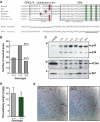
C/EBPα PHR motif is dispensable for WAT development and control of hepatocyte proliferation. (A) Alignment of C/EBPα CR4 fragments from vertebrates. The region required for CDK2/4 interaction (PHR motif) and the CR4 are indicated. The bars and * denote residues shown to be dephosphorylated in response to insulin signaling. The sequences of the ΔPHR and TTS alleles are shown, with the altered area underlined. The position of the first amino acid shown is indicated. (B) Ratios of weaned pups from 15 litters (104 pups) from intercrosses between _Cebpa_ΔPHR/+ mice. (C) Levels of C/EBPα (panel a) and PCNA (panel b) in rat H4IIE hepatoma cells and mouse liver were determined by Western blotting. Protein from approximately 3 × 10⁵ H4IIE cells or from nuclei of 2 mg liver was loaded. The Western blot was normalized by probing with Sp1 antibody (panel c). The bands corresponding to C/EBPα p42 and p30 are indicated. (D) Ratio of epididymal fat pad (mg) and total body (g) weight of fed wild-type control (+/+; _N_=9) or ΔPHR (Δ/Δ; _N_=8) mice. (E) Sections of epididymal fat pads from control (+/+) and ΔPHR (Δ/Δ) mice stained with hematoxylin–eosin.
Figure 2
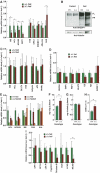
Deregulation of hepatic lipogenic gene expression in ΔPHR mice. (A) Relative mRNA expression of the indicated genes determined by RT–PCR was determined as described in Materials and methods using cDNA prepared from livers of wild-type control (+/+) or ΔPHR mice (_N_⩾5). The expression level of mRNA in control mice was set to 1. (B) Western blot of liver nuclear extract (100 μg/lane) from fed and overnight fasted +/+ and ΔPHR mice using anti-SREBP-1 (upper panel) and anti-tubulin (lower panel) antibodies. The positions of full-length (FL) and proteolytically cleaved (PR) SREBP-1c are indicated. (C) Relative mRNA expression of the indicated genes determined as in (A) using cDNA prepared from epididymal fat pads (_N_⩾5). (D) Relative mRNA expression of the indicated genes determined as in A (_N_⩾5). (E) Relative mRNA expression of the indicated genes determined by RT–PCR as in (A) using cDNA prepared from livers of at least four fed and four overnight fasted (16 h) control (+/+) and ΔPHR mice. (F) Triglyceride content was determined in livers of fed control (+/+; _N_=3) or ΔPHR (_N_=3) mice. (G) Cholesterol content in livers of fed control (+/+; _N_=4) or ΔPHR (_N_=4) mice. (H) Total triglyceride content of primary hepatocytes isolated from fed control (+/+) or ΔPHR mice. Triplicate cultures of each genotype were analyzed. (I) Relative mRNA expression of the indicated genes involved in lipid metabolism was determined by RT–PCR using cDNA prepared from livers of fed wild-type control (+/+) or ΔPHR mice as in (A) (_N_⩾5). *Indicated a significant difference (P<0.05, Student's _t_-test) from the wildtype value.
Figure 3
Co-localization and cooperation of C/EBPα and SREBP-1 on PHR-dependent promoters. (A) Chromatin immunoprecipitation on increasing amounts of X-linked liver extracts from fed mice was performed as described in the Materials and methods section using 4 μg anti-C/EBPα, anti-SREBP1 or unspecific rabbit IgG. Input material corresponding to 8 mg liver (In.) was loaded as control. M: 100-bp DNA marker. Each experiment was performed at least twice and representative results are shown. (B) ChIP and re-ChIP were performed as described in the Supplementary data section. Precipitated material from five ChIP reactions using anti-C/EBPα as described in (A), was pooled to perform the second round of ChIP. (C) S293 cells were transfected with expression vectors encoding the N-terminal 403 amino acids of SREBP1c and Flag-tagged full-length C/EBPα or C/EBPαΔPHR, as indicated. Input and anti-FLAG immunoprecipitates were analyzed by Western blotting using the indicated antibodies. (D) Liver nuclear extract (2 mg) from mice with the indicated genotypes were subjected to pull-down in the absence (–) or presence (Ig) of 1 mg rabbit IgG. Bound protein, as well as 5% of the Input (100 μg) was subjected to Western blotting with anti-C/EBPα and anti-SREBP-1 (2A4) antibodies. (E) S293 cells were cotransfected with a pACAS2-LUC and increasing amounts of expression vectors encoding wild-type C/EBPα (WT) or C/EBPαΔPHR, as indicated. Luciferase activity was measured 40 h post transfection, and are expressed as fold activation relative to the basal level of the reporter. C/EBPα expression levels were determined by Western blotting. Western blots where normalized by probing with anti-tubulin antibody (not shown). (F) S293 cells were cotransfected with pACAS2-LUC, expression vectors encoding WT C/EBPα or C/EBPαΔPHR and increasing amount of vector encoding (SREBP1c 1–403) as indicated (_N_=5). Luciferase activity and protein expression were determined as in (E). (G) S293 cells were cotransfected with pACL-LUC, expression vectors encoding SREBP1c (1–403) and increasing amounts of vector encoding WT C/EBPα or C/EBPαΔPHR as indicated. Luciferase activity and protein expression was determined as in E (_N_=4). (H) S293 cells were cotransfected with pACAS2-LUC (left panel) or pACAS2mSRE-LUC and expression vectors encoding SREBP1c (1–403) and increasing amounts of vector encoding C/EBPα as indicated (_N_=3). Luciferase activity was determined as in (E). *Indicated a significant difference (P<0.05, Student's _t_-test) from the wildtype value.
Figure 4
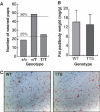
TTS mice are viable and show normal adipocyte development. (A) Ratios of weaned pups from 11 litters (93 pups) from intercrosses between _cebpa_TTS/+ mice. (B) Ratio of epididymal fat pad (mg) and total body (g) weight of fed WT (_N_=7) or TTS (_N_=7) mice. (C) Sections of epididymal fat pads from WT and TTS mice stained with hematoxylin–eosin.
Figure 5
Phosphorylation of the TTS site is metabolically regulated. (A) Protein extracts from approximately 10 mg liver, 20 mg lung and 200 mg epididymal fat pad isolated from fed and fasted WT and fed TTS mice were analyzed by Anderson PAGE and Western blotting. Western blots were developed using anti C/EBPα antibody (14AA). The phosphorylated and non-phosphorylated C/EBPα p42 and p30 forms are indicated. * indicates a nonspecific cross-reactive band. (B) NIH3T3 cells were infected with virus encoding wild-type C/EBPα or mutant C/EBPα T222A,T226A. Cells were analyzed for C/EBPα expression and Thr 222,226 phosphorylation by Western blotting using polyclonal anti-C/EBPα antibody (14AA) or monoclonal anti-C/EBPα phospho-Thr 222,226 (2C6), respectively. (C) Nuclear lysates prepared from 2 mg liver or 40 mg epididymal fat pads from fed or fasted WT mice were analyzed for C/EBPα content and threonine 222, 226 phosphorylation as in (B). Only the C/EBPα p42 form is shown for simplicity. Western blotting was normalized using anti-MAPK p42/44 antibody (MAPK). (D) Liver protein lysates was prepared from WT and TTS mice during a glucose tolerance test (Figure 7E). Mice were killed at the indicated time points and analyzed as in (A). Protein lysate from approximately 10 mg liver was loaded in each lane. (E) Nuclear lysates prepared from 2 mg liver from WT mice during a glucose tolerance test (as in D) were analyzed for C/EBPα content and T222,T226 phosphorylation by Western blotting as in (C).
Figure 6
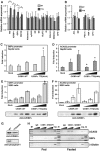
TTS mice show increased hepatic IRE controlled gene expression. (A) mRNA expression was analyzed by RT–PCR as in Figure 2A using cDNA prepared from livers from at least four fed WT or TTS mice. cy2b39: cytochrome 2b39; IR: insulin receptor; HMGCS-2: hydroxymethylglutaryl-CoA synthetase-2 (mitochondrial). (B) mRNA expression as in (A). (C) HepG2 cells were cotransfected with pG6Pc-LUC and increasing amounts (300 ng and 1 μg) of expression vectors encoding wild-type (WT) C/EBPα or C/EBPα TTS(AAA), as indicated. Luciferase activity was measured 40 h post transfection (_N_=5). (D) As in (C), except pACAS2-LUC reporter was used (_N_=4). (E) S293 cells were transfected as in C. The amounts of C/EBPα expression vector was 100 ng, 300 ng and 1 μg (_N_=4). C/EBPα expression levels in transfected cells were determined by Western blotting. (F) As in (E), except pACAS2-LUC reporter was used (_N_=4) (G) S293 cells were transfected with expression vectors encoding WT C/EBPα or C/EBPα TTS(AAA) as indicated. C/EBPα expression levels and phosphorylation on threonines 222 and 226 were determined by Western blotting as in Figure 5B. (H) ChIP experiments was performed as in Figure 3A using liver from fed or overnight fasted mice, as indicated. *Indicated a significant difference (P<0.05, Student's _t_-test) from the wildtype value.
Figure 7
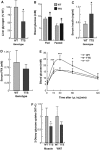
Glucose intolerance in TTS mice. (A) Relative glycogen levels in livers of WT (_N_=9) and TTS (_N_=12) mice. (B) Glucose concentration of tail vein blood from fed (_N_=14) and fasted (_N_=8) WT or fed (_N_=34) and fasted (_N_=19) TTS mice. (C) Insulin levels of serum from WT (_N_=6) and TTS (_N_=7) determined by ELISA. (D) Serum-free fatty acid levels from WT (_N_=6) and TTS (_N_=7) determined as described in Materials and methods. (E) Glucose tolerance test was performed on overnight fasted WT (_N_=6), WT (_N_=8) and TTS (_N_=10) mice as described in Materials and methods section. Blood glucose was measured immediately before and 15, 30, 60 and 120 min after glucose injection. *** P<10−5. (F) Relative 2-deoxy-glucose uptake in muscle and fat of overnight (16 h) fasted WT (_N_=6) and TTS (_N_=4) mice determined 1 h after glucose injection, as described in Materials and methods. *Indicated a significant difference (P<0.05, Student's _t_-test) from the wildtype value.
Similar articles
- Foxo1 links insulin signaling to C/EBPalpha and regulates gluconeogenesis during liver development.
Sekine K, Chen YR, Kojima N, Ogata K, Fukamizu A, Miyajima A. Sekine K, et al. EMBO J. 2007 Aug 8;26(15):3607-15. doi: 10.1038/sj.emboj.7601784. Epub 2007 Jul 12. EMBO J. 2007. PMID: 17627282 Free PMC article. - Functional characterisation of the regulation of CAAT enhancer binding protein alpha by GSK-3 phosphorylation of Threonines 222/226.
Liu HK, Perrier S, Lipina C, Finlay D, McLauchlan H, Hastie CJ, Hundal HS, Sutherland C. Liu HK, et al. BMC Mol Biol. 2006 Apr 6;7:14. doi: 10.1186/1471-2199-7-14. BMC Mol Biol. 2006. PMID: 16600022 Free PMC article. - Hepatic steatosis: a role for de novo lipogenesis and the transcription factor SREBP-1c.
Ferré P, Foufelle F. Ferré P, et al. Diabetes Obes Metab. 2010 Oct;12 Suppl 2:83-92. doi: 10.1111/j.1463-1326.2010.01275.x. Diabetes Obes Metab. 2010. PMID: 21029304 Review. - Regulation of gene expression by glycolytic and gluconeogenic enzymes.
Bian X, Jiang H, Meng Y, Li YP, Fang J, Lu Z. Bian X, et al. Trends Cell Biol. 2022 Sep;32(9):786-799. doi: 10.1016/j.tcb.2022.02.003. Epub 2022 Mar 14. Trends Cell Biol. 2022. PMID: 35300892 Review.
Cited by
- Active pyruvate dehydrogenase and impaired gluconeogenesis in orthotopic hepatomas of rats.
Lee MH, DeBerardinis RJ, Wen X, Corbin IR, Sherry AD, Malloy CR, Jin ES. Lee MH, et al. Metabolism. 2019 Dec;101:153993. doi: 10.1016/j.metabol.2019.153993. Epub 2019 Oct 28. Metabolism. 2019. PMID: 31672442 Free PMC article. - Lipin1 is a key factor for the maturation and maintenance of adipocytes in the regulatory network with CCAAT/enhancer-binding protein alpha and peroxisome proliferator-activated receptor gamma 2.
Koh YK, Lee MY, Kim JW, Kim M, Moon JS, Lee YJ, Ahn YH, Kim KS. Koh YK, et al. J Biol Chem. 2008 Dec 12;283(50):34896-906. doi: 10.1074/jbc.M804007200. Epub 2008 Oct 16. J Biol Chem. 2008. PMID: 18930917 Free PMC article. - A 12-Week, Single-Centre, Randomised, Double-Blind, Placebo-Controlled, Parallel-Design Clinical Trial for the Evaluation of the Efficacy and Safety of Lactiplantibacillus plantarum SKO-001 in Reducing Body Fat.
Shin SM, Park JS, Kim SB, Cho YH, Seo H, Lee HS. Shin SM, et al. Nutrients. 2024 Apr 11;16(8):1137. doi: 10.3390/nu16081137. Nutrients. 2024. PMID: 38674828 Free PMC article. Clinical Trial. - Pluripotent Stem Cell-Derived Hepatocytes Phenotypic Screening Reveals Small Molecules Targeting the CDK2/4-C/EBPα/DGAT2 Pathway Preventing ER-Stress Induced Lipid Accumulation.
Parafati M, Bae SH, Kirby RJ, Fitzek M, Iyer P, Engkvist O, Smith DM, Malany S. Parafati M, et al. Int J Mol Sci. 2020 Dec 15;21(24):9557. doi: 10.3390/ijms21249557. Int J Mol Sci. 2020. PMID: 33334026 Free PMC article. - High Fat Diet Induces Liver Steatosis and Early Dysregulation of Iron Metabolism in Rats.
Meli R, Mattace Raso G, Irace C, Simeoli R, Di Pascale A, Paciello O, Pagano TB, Calignano A, Colonna A, Santamaria R. Meli R, et al. PLoS One. 2013 Jun 21;8(6):e66570. doi: 10.1371/journal.pone.0066570. Print 2013. PLoS One. 2013. PMID: 23805238 Free PMC article.
References
- Aderem A (2005) Systems biology: its practice and challenges. Cell 121: 511–513 - PubMed
- Assaf S, Lagarrigue S, Daval S, Sansom M, Leclercq B, Michel J, Pitel F, Alizadeh M, Vignal A, Douaire M (2004) Genetic linkage and expression analysis of SREBP and lipogenic genes in fat and lean chicken. Comp Biochem Physiol B Biochem Mol Biol 137: 433–441 - PubMed
- Chomczynski P, Sacchi N (1987) Single-step method of RNA isolation by acid guanidinium thiocyanate–phenol–chloroform extraction. Anal Biochem 162: 156–159 - PubMed
- Courselaud B, Pigeon C, Inoue Y, Inoue J, Gonzalez FJ, Leroyer P, Gilot D, Boudjema K, Guguen-Guillouzo C, Brissot P, Loreal O, Ilyin G (2002) C/EBPalpha regulates hepatic transcription of hepcidin, an antimicrobial peptide and regulator of iron metabolism. Cross-talk between C/EBP pathway and iron metabolism. J Biol Chem 277: 41163–41170 - PubMed
Publication types
MeSH terms
Substances
LinkOut - more resources
Full Text Sources
Other Literature Sources
Molecular Biology Databases
