PDGFRs are critical for PI3K/Akt activation and negatively regulated by mTOR - PubMed (original) (raw)
PDGFRs are critical for PI3K/Akt activation and negatively regulated by mTOR
Hongbing Zhang et al. J Clin Invest. 2007 Mar.
Abstract
The receptor tyrosine kinase/PI3K/Akt/mammalian target of rapamycin (RTK/PI3K/Akt/mTOR) pathway is frequently altered in tumors. Inactivating mutations of either the TSC1 or the TSC2 tumor-suppressor genes cause tuberous sclerosis complex (TSC), a benign tumor syndrome in which there is both hyperactivation of mTOR and inhibition of RTK/PI3K/Akt signaling, partially due to reduced PDGFR expression. We report here that activation of PI3K or Akt, or deletion of phosphatase and tensin homolog (PTEN) in mouse embryonic fibroblasts (MEFs) also suppresses PDGFR expression. This was a direct effect of mTOR activation, since rapamycin restored PDGFR expression and PDGF-sensitive Akt activation in Tsc1-/- and Tsc2-/- cells. Akt activation in response to EGF in Tsc2-/- cells was also reduced. Furthermore, Akt activation in response to each of EGF, IGF, and PMA was reduced in cells lacking both PDGFRalpha and PDGFRbeta, implying a role for PDGFR in transmission of growth signals downstream of these stimuli. Consistent with the reduction in PI3K/Akt signaling, in a nude mouse model both Tsc1-/- and Tsc2-/- cells had reduced tumorigenic potential in comparison to control cells, which was enhanced by expression of either active Akt or PDGFRbeta. In conclusion, PDGFR is a major target of negative feedback regulation in cells with activated mTOR, which limits the growth potential of TSC tumors.
Figures
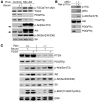
Figure 1. Activation of the PI3K/Akt/mTOR pathway reduces PDGFR expression.
Immunoblot analysis is shown for multiple MEF lines. (A and C) MEFs were starved for 2 days and stimulated with either 10% FBS or 50 ng/ml PDGFbb for 10 minutes. (A) MEFs with ectopic myr-Akt have elevated p-TSC2, p-Akt, and p-S6 levels and markedly reduced PDGFRα and PDGFRβ levels in comparison to control cells. Arrows indicate endogenous Akt. (B) WT immortalized MEFs transiently expressing the p85α and myristoylated p110α subunits of PI3K show a marked reduction in levels of expression of both PDGFRα and PDGFRβ. (C) PTEN-null MEFs show increases in expression of p-Akt and p-S6, with a decrease in PDGFRβ expression.
Figure 2. mTOR suppresses PDGFR expression.
(A and B) Immunoblot analysis is shown for Pten–/–, Tsc1–/–(A), and Tsc2–/– (B) MEFs. (A) Cells were treated with 10 nM rapamycin for variable time periods, up to 24 hours. (B) Cells were starved in DMEM with rapamycin for 24 hours; treated with or without 0.1 μM wortmannin for 30 minutes; then stimulated with 10% FCS (left) or 50 ng/ml PDGFbb (right) for 10 minutes. Note that rapamycin immediately decreased p-S6 levels and led to a delayed increase in IRS1 and PDGFRβ levels. (C) Real-time quantitative RT-PCR analysis of PDGFRα and PDGFRβ mRNA levels is shown for untreated and 24-hour rapamycin–treated (10 nM) _Tsc1–/–_and WT MEFs. Error bars indicate SD for n = 2 experiments. Note the marked decrease in PDGFR mRNA levels in Tsc1–/– cells, which were increased by rapamycin treatment.
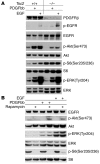
Figure 3. mTOR activation inhibits signaling of both PDGF and EGF to Akt.
MEFs were serum starved for 24 hours and then stimulated with 25 ng/ml PDGFbb or 50 ng/ml EGF for 10 minutes. Cell lysates were then subjected to Western blot analysis. (A) Note similar patterns of p-ERK increase in response to PDGF and EGF in both WT and _Tsc2_–/– cells. In contrast, p-Akt levels were reduced in response to both EGF and PDGF in the Tsc2–/– cell line. (B) Note enhancement of p-Akt levels in Tsc2–/– cells in response to rapamycin (100 nM for 24 hours) and PDGF or EGF treatment.
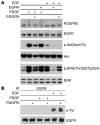
Figure 4. Inhibition of PDGFR impairs EGF-mediated Akt activation.
WT MEFs were serum starved for 24 hours; with or without pretreatment with 2.5 μM AG1295 (PDGFR inhibitor [PDGFRi]) or 0.1 μM AG1478 (EGFR inhibitor [EGFRi]) for 30 minutes; and then stimulated with 50 ng/ml PDGFbb or EGF for 10 minutes. Cell lysates were then subjected to immunoblot analysis (A) or immunoprecipitation for EGFR, followed by immunoblotting (B). Note equivalent suppression of p-Akt levels by both AG1478 and AG1295 pretreatment in EGF-stimulated cells (A). AG1295 does not prevent tyrosine phosphorylation of EGFR by EGF (B).
Figure 5. Akt activation by EGF, IGF, and PMA is reduced in cells lacking PDGFR.
(A–C) Immunoblots of cell lysates. Each set of 3 lanes in A consists of lysates from PDGFRα/β double-null, Pdgfra–/–, and Pdgfrb–/– MEFs. All cells were serum starved for 48 hours and then stimulated with 50 ng/ml PDGFbb, 50 ng/ml EGF, 50 ng/ml IGF, or 10% serum for 10 minutes; or 200 nM PMA for 30 minutes. p-Akt levels were markedly reduced in PDGFRα/β double-null cells in response to all stimuli. (D) Immunoblots of WT or Egfr–/– MEFs. Cells were serum starved for 24 hours and stimulated with 50 ng/ml EGF (E), 50 ng/ml TGF-α (T), 50 ng/ml PDGF (P), 50 ng/ml IGF (I), or 0.2 nM insulin (In) for 10 minutes. Note that phosphorylation of Akt, S6, and ERK in response to PDGF, IGF, and insulin was similar in Egfr–/– and control MEFs.
Figure 6. Tsc1-null and Tsc2-null MEFs have reduced tumorigenic potential.
Tumor development and survival curves are shown for immunodeficient nude mice after subcutaneous inoculation with 1 × 10⁶ MEFs. Mice receiving _Tsc1–/–_cells (A) or Tsc2–/– cells (B) had delayed tumor formation and a longer survival than mice receiving control cells. All cells used in B were deficient in tumor suppressor gene TP53.
Figure 7. Restoration of PDGFR/Akt signaling potentiates the tumorigenicity of Tsc1-null and Tsc2-null cells.
(A) myr-Akt expression restores p-Akt levels in Tsc2–/– MEFs (left); markedly accelerates tumor formation (middle); and reduces survival (right) of immunodeficient nude mice injected with these cells in comparison to controls treated with vector alone. (B and C) PDGFRβ expression increases serum-induced p-Akt levels in Tsc1–/– (B) and Tsc2–/– (C) MEFs (left); accelerates tumor formation (middle); and reduces survival (right) of immunodeficient nude mice injected with these cells in comparison to controls treated with vector alone.
Similar articles
- Loss of Tsc1/Tsc2 activates mTOR and disrupts PI3K-Akt signaling through downregulation of PDGFR.
Zhang H, Cicchetti G, Onda H, Koon HB, Asrican K, Bajraszewski N, Vazquez F, Carpenter CL, Kwiatkowski DJ. Zhang H, et al. J Clin Invest. 2003 Oct;112(8):1223-33. doi: 10.1172/JCI17222. J Clin Invest. 2003. PMID: 14561707 Free PMC article. - ER stress negatively regulates AKT/TSC/mTOR pathway to enhance autophagy.
Qin L, Wang Z, Tao L, Wang Y. Qin L, et al. Autophagy. 2010 Feb;6(2):239-47. doi: 10.4161/auto.6.2.11062. Epub 2010 Mar 1. Autophagy. 2010. PMID: 20104019 - Efficacy of combined inhibition of mTOR and ERK/MAPK pathways in treating a tuberous sclerosis complex cell model.
Mi R, Ma J, Zhang D, Li L, Zhang H. Mi R, et al. J Genet Genomics. 2009 Jun;36(6):355-61. doi: 10.1016/S1673-8527(08)60124-1. J Genet Genomics. 2009. PMID: 19539245 - A complex interplay between Akt, TSC2 and the two mTOR complexes.
Huang J, Manning BD. Huang J, et al. Biochem Soc Trans. 2009 Feb;37(Pt 1):217-22. doi: 10.1042/BST0370217. Biochem Soc Trans. 2009. PMID: 19143635 Free PMC article. Review. - Oncogenic Roles of the PI3K/AKT/mTOR Axis.
Aoki M, Fujishita T. Aoki M, et al. Curr Top Microbiol Immunol. 2017;407:153-189. doi: 10.1007/82_2017_6. Curr Top Microbiol Immunol. 2017. PMID: 28550454 Review.
Cited by
- Recent advances and limitations of mTOR inhibitors in the treatment of cancer.
Ali ES, Mitra K, Akter S, Ramproshad S, Mondal B, Khan IN, Islam MT, Sharifi-Rad J, Calina D, Cho WC. Ali ES, et al. Cancer Cell Int. 2022 Sep 15;22(1):284. doi: 10.1186/s12935-022-02706-8. Cancer Cell Int. 2022. PMID: 36109789 Free PMC article. Review. - Rheb/mTORC1 signaling promotes kidney fibroblast activation and fibrosis.
Jiang L, Xu L, Mao J, Li J, Fang L, Zhou Y, Liu W, He W, Zhao AZ, Yang J, Dai C. Jiang L, et al. J Am Soc Nephrol. 2013 Jun;24(7):1114-26. doi: 10.1681/ASN.2012050476. Epub 2013 May 9. J Am Soc Nephrol. 2013. PMID: 23661807 Free PMC article. - A Molecular Mechanism Study to Reveal Hirudin's Downregulation to PI3K/AKT Signaling Pathway through Decreasing PDGFR_β_ in Renal Fibrosis Treatment.
Li Y, Zhang L, Xiong W, Gao X, Xiong Y, Sun W. Li Y, et al. Biomed Res Int. 2022 Sep 7;2022:5481552. doi: 10.1155/2022/5481552. eCollection 2022. Biomed Res Int. 2022. PMID: 36119923 Free PMC article. Retracted. - Mammalian target of rapamycin signaling and autophagy: roles in lymphangioleiomyomatosis therapy.
Yu J, Parkhitko AA, Henske EP. Yu J, et al. Proc Am Thorac Soc. 2010 Feb;7(1):48-53. doi: 10.1513/pats.200909-104JS. Proc Am Thorac Soc. 2010. PMID: 20160148 Free PMC article. Review. - Tenascin-C promotes melanoma progression by maintaining the ABCB5-positive side population.
Fukunaga-Kalabis M, Martinez G, Nguyen TK, Kim D, Santiago-Walker A, Roesch A, Herlyn M. Fukunaga-Kalabis M, et al. Oncogene. 2010 Nov 18;29(46):6115-24. doi: 10.1038/onc.2010.350. Epub 2010 Aug 23. Oncogene. 2010. PMID: 20729912 Free PMC article.
References
- Schlessinger J. Cell signaling by receptor tyrosine kinases. Cell. 2000;103:211–225. - PubMed
- Cully M., You H., Levine A.J., Mak T.W. Beyond PTEN mutations: the PI3K pathway as an integrator of multiple inputs during tumorigenesis. Nat. Rev. Cancer. 2006;6:184–192. - PubMed
- Thomas G.V. mTOR and cancer: reason for dancing at the crossroads? Curr. Opin. Genet. Dev. 2006;16:78–84. - PubMed
- Hay N. The Akt-mTOR tango and its relevance to cancer. Cancer Cell. 2005;8:179–183. - PubMed
- Samuels Y., Ericson K. Oncogenic PI3K and its role in cancer. Curr. Opin. Oncol. 2006;18:77–82. - PubMed
Publication types
MeSH terms
Substances
Grants and funding
- LM07092/LM/NLM NIH HHS/United States
- R01 NS031535/NS/NINDS NIH HHS/United States
- T15 LM007092/LM/NLM NIH HHS/United States
- R37 NS031535/NS/NINDS NIH HHS/United States
- P01 NS024279/NS/NINDS NIH HHS/United States
- NS24279/NS/NINDS NIH HHS/United States
- NS31535/NS/NINDS NIH HHS/United States
LinkOut - more resources
Full Text Sources
Other Literature Sources
Molecular Biology Databases
Research Materials
Miscellaneous


