Surviving endoplasmic reticulum stress is coupled to altered chondrocyte differentiation and function - PubMed (original) (raw)
doi: 10.1371/journal.pbio.0050044.
Danny Chan, Deborah Cheslett, Wilson C W Chan, Chi Leong So, Ian G Melhado, Tori W Y Chan, Kin Ming Kwan, Ernst B Hunziker, Yoshihiko Yamada, John F Bateman, Kenneth M C Cheung, Kathryn S E Cheah
Affiliations
- PMID: 17298185
- PMCID: PMC1820825
- DOI: 10.1371/journal.pbio.0050044
Surviving endoplasmic reticulum stress is coupled to altered chondrocyte differentiation and function
Kwok Yeung Tsang et al. PLoS Biol. 2007 Mar.
Abstract
In protein folding and secretion disorders, activation of endoplasmic reticulum (ER) stress signaling (ERSS) protects cells, alleviating stress that would otherwise trigger apoptosis. Whether the stress-surviving cells resume normal function is not known. We studied the in vivo impact of ER stress in terminally differentiating hypertrophic chondrocytes (HCs) during endochondral bone formation. In transgenic mice expressing mutant collagen X as a consequence of a 13-base pair deletion in Col10a1 (13del), misfolded alpha1(X) chains accumulate in HCs and elicit ERSS. Histological and gene expression analyses showed that these chondrocytes survived ER stress, but terminal differentiation is interrupted, and endochondral bone formation is delayed, producing a chondrodysplasia phenotype. This altered differentiation involves cell-cycle re-entry, the re-expression of genes characteristic of a prehypertrophic-like state, and is cell-autonomous. Concomitantly, expression of Col10a1 and 13del mRNAs are reduced, and ER stress is alleviated. ERSS, abnormal chondrocyte differentiation, and altered growth plate architecture also occur in mice expressing mutant collagen II and aggrecan. Alteration of the differentiation program in chondrocytes expressing unfolded or misfolded proteins may be part of an adaptive response that facilitates survival and recovery from the ensuing ER stress. However, the altered differentiation disrupts the highly coordinated events of endochondral ossification culminating in chondrodysplasia.
Conflict of interest statement
Competing interests. The authors have declared that no competing interests exist.
Figures
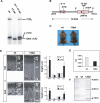
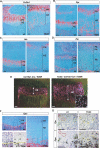
Figure 1. Impaired Collagen X Assembly and Growth Plate Abnormality
(A) Cell-free translation demonstrating normal assembly of wt α-chains into α1(X)3 homotrimers, but impaired assembly of 13del α-chains into trimers. Heterotrimers, which would migrate slightly faster than the α1(X)3 homotrimers, are absent. (B) Diagram of the 10.4-kb Col10a1-13del transgene. The NC1-encoding domain is indicated by the shaded region. (C) Ten-week-old wt and 13del mice. (D) Left: histology of the proximal tibial growth plates of 10-d-old (10d) and 4-wk-old (4wk) wt and 13del mice. Right: differences in the total height of the growth plate and in the heights of the RZ, PZ, and HZ between wt and 13del mice in each age group (10 d [n = 6] and 4 wk [n = 13]). Bar indicates 100 μm. (E) Retarded longitudinal bone growth in 13del mice. Calcein (10 mg/kg body weight) was injected intraperitoneally into 5-d-old mice that were sacrificed 5 d later. Sections of proximal tibia were examined in an incident-light fluorescence microscope. The distances at different positions between the zone of vascular invasion at the growth plate and the proximal endpoint of the calcein label in the trabecular bone were determined using a micrometric eyepiece. The mean distance represented the rate of longitudinal bone growth over 5 d. Error bars represent ±1 standard deviation (SD). Longitudinal growth was retarded in 13del mice over 5–10 d, being only about half that in wt littermates (0.498 ± 0.013 mm for wt and 0.277 ± 0.025 mm for 13del; n = 3 for each genotype; p = 5.2 × 10⁻⁶). (F) RNase protection assay. The protected fragments of [α-33P]UTP-labeled probes when hybridized with wt Col10a1 transcript are 354 bases; whereas hybridization with 13del transcripts gives two fragments of 201 bases and 140 bases (the unpaired 13 bases are digested by RNase). PS, primary spongiosa.
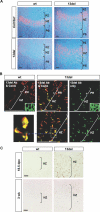
Figure 2. Intracellular Accumulation of 13del Proteins
(A) In situ hybridization for wt Col10a1 or 13del transcripts at 10-d-old proximal tibial growth plates. (B) Immunofluorescence of cryosections immunostained with a 13del-specific antibody (13del Ab, green fluorescence). Absence of staining in the HZ of wt littermates showed the antibody is specific for 13del protein (Figure 1G, wt panel). Red fluorescence signal marks concanavalin A (ConA) in the ER. Localization of 13del proteins within the ER (yellow) is shown by the overlapping green and red fluorescence signals. Insets show extracellular immunostaining for normal collagen X in wt and 13del mice. (C) Immunohistochemistry using 13del-specific antibody on paraffin-embedded proximal tibial growth plate sections. Specific staining (brown) was seen only in 13del HZ. The sections were not counterstained in order to access the intensity of staining more easily. Bar indicates 100 μm.
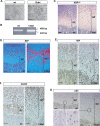
Figure 3. Induction of ERSS in 13del HCs
Analyses of 10-d-old proximal tibial growth plates. (A) Electron micrographs of wt and 13del HCs showing distended and fragmented ER (bar indicates 1 μm). (B) RT-PCR of total RNA from hypertrophic cartilage: 469 bp: unspliced Xbp1 mRNA; 443 bp: spliced Xbp1s. Sequencing of the 443-bp PCR-fragment confirmed that it is the product of Xbp1s mRNA (unpublished data). (C–E) Expression of XBP1s and BiP revealed by in situ hybridization (D) and immunostaining (C and E). (F and G) Immunohistochemical detection of CHOP (F) and p53 (G). The boxes in (G) indicate the region of higher magnification shown in the bottom left corner. Color contrast of the low-power magnification images in (C–G) were adjusted as described in Materials and Methods. Bar indicates 100 μm.
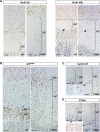
Figure 4. Abnormal Cell-Cycle Regulation in 13del HCs
(A) BrdU pulse/chase assay. Left panel; 5-d-old mice were injected with a single dose of BrdU and sacrificed 2 h later. Right panel; 8-d-old mice received two pulses of BrdU with an intervening interval of 6 h and were sacrificed 48 h after the first injection. The rate of chondrocyte hypertrophy is similar in wt and 13del mice; the most distally located BrdU-labeled cells (arrowheads) occurred at the same level relative to the onset of the HZ. (B–D) Immunohistochemical detection of p57Kip2 (B), cyclin D1 (C), and PCNA (D). The boxes in (C and D) indicate the regions of higher magnification shown in the bottom left corner. Color contrast of the low-power magnification images in (A–D) were adjusted as described in Materials and Methods. Bar indicates 100 μm.
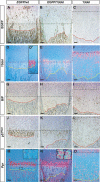
Figure 5. Altered Differentiation of HCs to “PreHC-Like” Cells
Analyses of the proximal tibial growth plate of 10-day-old mice. (A–D and F) In situ hybridization using specific markers for resting, proliferating chondrocytes, and preHCs (Col2a1) (A), preHCs (Ppr) (B), preHCs and HCs (Ihh) (C), proliferating chondrocytes (Ptc) (D), and terminal HCs (Opn) (F). The chondro-osseous junction is depicted by a yellow line). (E) To show that altered differentiation took place after the initiation of hypertrophy, X-gal staining was performed on 10-d-old Col10a1-Cre/ROSA26 Cre reporter (R26R) mice with or without the 13del transgene. Positive staining appears as pink under dark field. The inset in the 13del panel shows co-localized X-gal staining (pink) and Ppr in situ hybridization signal (white dots) in mid-lower HZ of the triple mutant. (G) In situ hybridization for Opn and Ppr in consecutive sections. In some HCs of 13del mice, Opn and Ppr are co-expressed (yellow-circled cells). In wt mice, the expression profiles of Opn and Ppr are mutually exclusive (see red- and green-circled cells). Bar indicates 100 μm.
Figure 6. The Signal for the Altered Differentiation of 13del HCs Is Cell Autonomous
Analyses of EGFP/wt and EGFP/13del chimeras. (A, B, and C) In EGFP/13del chimeras, normal (wt) cells express EGFP. (D, E, and F) 13del cells are identified by in situ hybridization with a 64-bp probe specific for the 13del transcripts. (D′) shows expression of Col10a1 in the normal EGFP/wt chimera (consecutive section). (G–I) Immunohistochemical detection for BiP. (J–L) Immunohistochemical detection for p57Kip2. (M–O) In situ hybridization for Ppr. The insets in (M) and (N) show regions in the LHZ containing wt and 13del cells, respectively, at higher magnification. (N) shows marked re-expression of Ppr in 13del cells. Chondro-osseous junctions are traced using a red or yellow line. Color contrast of (A–C) and (G–L) was adjusted as described in Materials and Methods. Bar indicates 100 μm.
Figure 7. The Dynamics of Transgene and BiP Expression, HZ Expansion, and Altered Differentiation during Prenatal Growth
Gene expression analyses on the proximal tibial growth plates from 14.5 (A1–A5 and A1′–A5′), 15.5 (B1–B5 and B1′–B5′), and 17.5 dpc (C1–C5 and C1′–C5′) mice. In situ hybridization was performed on paraffin sections using probes detecting Col10a1 (first column in both 13del and wt sections), 13del (second column in each section), BiP (third column in each section), Ppr (fourth column in each section), and Opn (fifth column in each section). Brackets indicate HZ. Bar indicates 100 μm.
Figure 8. The Dynamics of Transgene and BiP Expression, HZ Expansion, and Altered Differentiation during Postnatal Growth
Gene expression analyses on the proximal tibial growth plates from 10-d-old (A1–A5 and A1′–A5′), 3-wk-old (B1–B5 and B1′–B5′), 4-wk-old (C1–C5 and C1′–C5′), and 10-wk-old (D1–D5 and D1′–D5′) mice. In situ hybridization was performed on paraffin sections using probes detecting Col10a1 (first column in both 13del and wt sections), 13del (second column in each section), BiP (third column in each section), Ppr (fourth column in each section), and Opn (fifth column in each section). The insets in (C4) shows a region (marked by broken lines) in the LHZ at higher magnification, containing 13del cells that re-expressed Ppr. Brackets indicate HZ. Bar indicates 100 μm.
Figure 9. Correlation of Altered Differentiation of HCs and ERSS
Serial transverse sections of 10-d-old tibiae were collected for quantitative RT-PCR analyses. A section between each fraction of 20 sections was stained with safranin-O and the von Kossa stain to identify the bony or cartilaginous nature of each fraction. The section around the chondro-osseous junction is shown from wt (A) and 13del (B) mice. Mineralized tissues stained dark brown and cartilaginous tissues stained orange. Relative transcript abundance was quantified for Col10a1 and 13del, BiP, and Mmp9 in wt (A) and 13del (B). The Col10a1 primers also recognize 13del transcripts. Fractions are numbered from the bone shaft towards the growth plate cartilage for reference only, and there is no correlation between wt and 13del fractions. The position of the fractions relative to the bone and HZ of the growth plate is indicated. The HZ is delineated by a pair of dotted line in each graph; PZ and RZ are on the right-hand side of the HZ. Error bars represent ±1 standard deviation (SD).
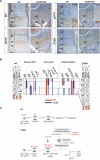
Figure 10. ERSS in cmd/cmd Mutant and a Model for Surviving ER Stress
(A) ERSS and disrupted chondrocyte differentiation in the growth plate of the cmd/cmd mutant. Immunohistochemical detection of BiP, P57Kip2, PCNA, and collagen X (ColX) in the tibial growth plates of 18.5 dpc fetus. Color contrast of these images was adjusted as described in Materials and Methods. Bar indicates 100 μm. (B) Comparative summary of expression pattern for molecular markers in the growth plate in wt and 13del mice. (C) Model for the reprogramming of HCs in 13del transgenic mice expressing unfolded collagen X. AC, zone containing abnormal chondrocytes; p53(c), cytoplasmic localized p53.
Similar articles
- COL10A1 nonsense and frame-shift mutations have a gain-of-function effect on the growth plate in human and mouse metaphyseal chondrodysplasia type Schmid.
Ho MS, Tsang KY, Lo RL, Susic M, Mäkitie O, Chan TW, Ng VC, Sillence DO, Boot-Handford RP, Gibson G, Cheung KM, Cole WG, Cheah KS, Chan D. Ho MS, et al. Hum Mol Genet. 2007 May 15;16(10):1201-15. doi: 10.1093/hmg/ddm067. Epub 2007 Apr 2. Hum Mol Genet. 2007. PMID: 17403716 - Leptin regulates chondrocyte differentiation and matrix maturation during endochondral ossification.
Kishida Y, Hirao M, Tamai N, Nampei A, Fujimoto T, Nakase T, Shimizu N, Yoshikawa H, Myoui A. Kishida Y, et al. Bone. 2005 Nov;37(5):607-21. doi: 10.1016/j.bone.2005.05.009. Epub 2005 Jul 20. Bone. 2005. PMID: 16039170 - A novel role for Bcl-2 associated-athanogene-1 (Bag-1) in regulation of the endoplasmic reticulum stress response in mammalian chondrocytes.
Yang L, McBurney D, Tang SC, Carlson SG, Horton WE Jr. Yang L, et al. J Cell Biochem. 2007 Oct 15;102(3):786-800. doi: 10.1002/jcb.21328. J Cell Biochem. 2007. PMID: 17546604 - Integration of signaling pathways regulating chondrocyte differentiation during endochondral bone formation.
Adams SL, Cohen AJ, Lassová L. Adams SL, et al. J Cell Physiol. 2007 Dec;213(3):635-41. doi: 10.1002/jcp.21262. J Cell Physiol. 2007. PMID: 17886256 Review. - Cellular responses to endoplasmic reticulum stress and apoptosis.
Rasheva VI, Domingos PM. Rasheva VI, et al. Apoptosis. 2009 Aug;14(8):996-1007. doi: 10.1007/s10495-009-0341-y. Epub 2009 Apr 10. Apoptosis. 2009. PMID: 19360473 Review.
Cited by
- Advances in Skeletal Dysplasia Genetics.
Geister KA, Camper SA. Geister KA, et al. Annu Rev Genomics Hum Genet. 2015;16:199-227. doi: 10.1146/annurev-genom-090314-045904. Epub 2015 Apr 22. Annu Rev Genomics Hum Genet. 2015. PMID: 25939055 Free PMC article. Review. - Collagen misfolding mutations: the contribution of the unfolded protein response to the molecular pathology.
Bateman JF, Shoulders MD, Lamandé SR. Bateman JF, et al. Connect Tissue Res. 2022 May;63(3):210-227. doi: 10.1080/03008207.2022.2036735. Epub 2022 Feb 26. Connect Tissue Res. 2022. PMID: 35225118 Free PMC article. Review. - A mutation in Ihh that causes digit abnormalities alters its signalling capacity and range.
Gao B, Hu J, Stricker S, Cheung M, Ma G, Law KF, Witte F, Briscoe J, Mundlos S, He L, Cheah KS, Chan D. Gao B, et al. Nature. 2009 Apr 30;458(7242):1196-200. doi: 10.1038/nature07862. Epub 2009 Mar 1. Nature. 2009. PMID: 19252479 - A systems biology approach identifies a regulatory network in parotid acinar cell terminal differentiation.
Metzler MA, Venkatesh SG, Lakshmanan J, Carenbauer AL, Perez SM, Andres SA, Appana S, Brock GN, Wittliff JL, Darling DS. Metzler MA, et al. PLoS One. 2015 Apr 30;10(4):e0125153. doi: 10.1371/journal.pone.0125153. eCollection 2015. PLoS One. 2015. PMID: 25928148 Free PMC article. - Site-1 protease is essential for endochondral bone formation in mice.
Patra D, Xing X, Davies S, Bryan J, Franz C, Hunziker EB, Sandell LJ. Patra D, et al. J Cell Biol. 2007 Nov 19;179(4):687-700. doi: 10.1083/jcb.200708092. J Cell Biol. 2007. PMID: 18025304 Free PMC article.
References
- Rutkowski DT, Kaufman RJ. A trip to the ER: Coping with stress. Trends Cell Biol. 2004;14:20–28. - PubMed
- Calfon M, Zeng H, Urano F, Till JH, Hubbard SR, et al. IRE1 couples endoplasmic reticulum load to secretory capacity by processing the XBP-1 mRNA. Nature. 2002;415:92–96. - PubMed
- Yoshida H, Matsui T, Yamamoto A, Okada T, Mori K. XBP1 mRNA is induced by ATF6 and spliced by IRE1 in response to ER stress to produce a highly active transcription factor. Cell. 2001;107:881–891. - PubMed
- Iwakoshi NN, Lee AH, Vallabhajosyula P, Otipoby KL, Rajewsky K, et al. Plasma cell differentiation and the unfolded protein response intersect at the transcription factor XBP-1. Nat Immunol. 2003;4:321–329. - PubMed
Publication types
MeSH terms
Substances
LinkOut - more resources
Full Text Sources
Other Literature Sources
Molecular Biology Databases
