Dido disruption leads to centrosome amplification and mitotic checkpoint defects compromising chromosome stability - PubMed (original) (raw)
Dido disruption leads to centrosome amplification and mitotic checkpoint defects compromising chromosome stability
Varvara Trachana et al. Proc Natl Acad Sci U S A. 2007.
Abstract
Numerical and/or structural centrosome abnormalities have been correlated with most solid tumors and hematological malignancies. Tumorigenesis also is linked to defects in the mitotic or spindle assembly checkpoint, a key control mechanism that ensures accurate segregation of chromosomes during mitosis. We have reported that targeted disruption of the Dido gene causes a transplantable myelodysplastic/myeloproliferative disease in mice. Here, we report that Dido3, the largest splice variant of the Dido gene, is a centrosome-associated protein whose disruption leads to supernumerary centrosomes, failure to maintain cellular mitotic arrest, and early degradation of the mitotic checkpoint protein BubR1. These aberrations result in enhanced aneuploidy in the Dido mutant cells. Dido gene malfunction thus is reported to be part of an impaired signaling cascade that results in a defective mitotic checkpoint, leading to chromosome instability.
Conflict of interest statement
The authors declare no conflict of interest.
Figures
Fig. 1.
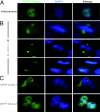
Dido3 localizes at centrosomes/spindle poles. (A) Dido3 has a distinct two-dot localization pattern in HeLa cells, reminiscent of centrosomes (interphase). (B) During mitosis, Dido3 translocates to mitotic poles in early metaphase and remains pole-associated throughout mitosis. (Upper) Dido3 localization early in mitosis. (Middle and Bottom) Mid- and late mitosis, respectively. (C) GFP-Dido1 is seen mainly in cytoplasm of HeLa cells (Upper), whereas GFP-Dido2 is nuclear (Lower). These isoforms did not associate with centrosomes or spindle poles.
Fig. 2.
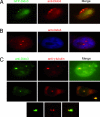
Endogenous human Dido3 colocalizes with γ-tubulin. (A) HeLa cells expressing GFP-Dido3 (green), stained with anti-Dido3 (red), showed overlapping localization. (B) In untransfected HeLa cells, anti-Dido3 (red) revealed the same pattern for endogenous human Dido3 as for GFP-Dido3. (C) Staining of HeLa cells with anti-Dido3 (green) and anti-γ-tubulin (red) confirmed Dido3 centrosome localization. Confocal microscopy images of Dido3 (green) and γ-tubulin (red) localization indicated possible differences in the amount of Dido3 associated with each centrosome when centrosomes were in proximity (Middle and Bottom).
Fig. 3.
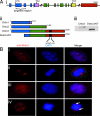
Targeted Dido gene disruption results in an N-terminal-truncated Dido3 form that loses centrosome association. (Ai) Dido gene architecture. A common N-terminal domain (blue) is followed by a specific C-terminal domain for each of the three splice variants (pink, green, yellow, and red). The domain targeted in mutant mice is indicated. (Aii) Dido3ΔNT is the truncated Dido3 form in mutant cells after disrupting the targeted region of the Dido gene, as in Ai. (Aiii) Western blot of WT and _Dido_-targeted (mutant) MEF lysates stained with anti-Dido3. The lower band is the truncated form of Dido3. (B) MEFs were stained with anti-Dido3 (red) and DAPI (blue). (Bi and Bii) In interphase (Bi) and mitotic (Bii) WT cells, Dido3 clearly associates with centrosomes/spindle poles. (Biii) In interphase mutant cells, the Dido3-truncated form shows a diffuse nuclear localization without the two-dot centrosome pattern. (Biv) In mitotic mutant cells, there is no spindle pole association and chromosomes appear to be misaligned (arrows).
Fig. 4.
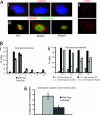
Targeted Dido disruption leads to centrosome amplification and spindle malformation. (Ai) Anti-γ-tubulin staining revealed mutant MEFs with 4, 8, or 12 centrosomes. (Aii) Anti-centrin staining confirmed centrosome amplification in mutant cells (Lower), whereas WT MEFs showed normal numbers (Upper). (Aiii) MEFs were stained with anti-α-tubulin (red) to show spindle formation. DNA was stained with SYBR-Green. WT MEFs (Left) had normal spindle formation. Mutants formed a spindle with four poles (Center) or a completely disorganized spindle (Right). (Bi) We counted centrosomes in anti-γ-tubulin-stained WT and mutant MEFs. The x axis shows centrosomes per cell. Approximately 23% of _Dido_-mutant cells had three or more centrosomes, whereas only 3.9% of WT cells showed this abnormal number. (Bii) Percentage of WT and mutant MEFs showing ≤2 or >2 centrosomes per cell after hydroxyurea treatment. The percentage of mutant cells with aberrant centrosome numbers increased with time, reaching >40% of total cells at 48 h. The x axis depicts time of hydroxyurea treatment. (Biii) Freshly isolated BM samples stained with anti-γ-tubulin. A significantly larger percentage of cells from mutant mice had more than two centrosomes compared with cells from WT mice (Student's t test, P = 0.008).
Fig. 5.
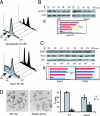
Dido disruption leads to a dysfunctional SAC and enhanced chromosome instability. (A) WT and mutant cells were presynchronized with aphidicolin and released into nocodazole (Upper) or taxol (Lower) to trigger mitotic arrest. Cells were fixed, propidium iodide-stained, and analyzed by FACS. The majority of WT cells were arrested as a 4N population, whereas mutant cells failed to maintain arrest for longer than 16–18 h, giving rise to an additional 2N population. The figure is representative of at least four independent experiments of drug treatment for 16–18 h. (Bi) WT and mutant cells, taxol-treated as above for the times indicated, were tested in Western blot with equal amounts of total cell lysates by using anti-cyclin B1 (Upper). Coincident with the rapid decrease in the mitotic population of mutant cells at 16–18 h after taxol treatment (A), cyclin B1 levels dropped drastically after 16 h. cdc2 protein levels were unchanged in both cell types (Lower). (Bii) Quantification of cyclin B1 levels from WT and mutant cell lysates. Quantification was performed on the Western blots by using ImageJ software. (Ci) Cell lysates as in B were tested in Western blot with anti-BubR1 (Top). The double band probably represents hyper- and hypophosphorylated BubR1 forms. At 16 h after taxol treatment, BubR1 levels were no longer detected in mutant cells. Mad2 protein levels were unchanged and were similar for WT and mutant cells (Center). Anti-actin was used as loading control (Bottom). (Cii) Quantification of BubR1 (Left) and Mad2 levels (Right), as in Ci. (D Left and Center) Metaphase spreads from WT (Left) and mutant (Center) MEFs treated with colcemid for 4 h. (Right) Individual chromosome counts from WT (left) and mutant (right) MEFs were grouped as cells with normal karyotype (diploid, N) and cells with abnormal karyotype (aneuploid, ≠N). The percentage of aneuploid mutant cells was significantly higher than that of WT cells (Student's t test, P = 0.0088).
Fig. 6.
Dido mutants have cytokinesis defects. (A) _Dido_-mutant MEFs were stained with anti-γ-tubulin (red) and DAPI (blue). (Ai) Cells connected by an intercellular bridge (arrow). (Aii) A typical double-nucleus phenotype, indicating cell division failure. (Aiii) To confirm the existence of binucleated cells, we used a cytoplasmic membrane probe in confocal microscopy; DNA was stained with SYBR-Green. Two adjacent but separate WT cells are seen (Left). Binucleated mutant cells show a single membrane around the nuclei (Right). (Aiv) Representative images of bone marrow samples from _Dido_-targeted mice; arrows indicate binucleated cells in freshly isolated (Left) or 6-day cultured BM cells (Right). (B) Quantification of defective divisions. A significantly larger percentage of _Dido_-mutant than WT cells remained joined by intercellular bridges (Student's t test, P = 0.0015). A larger percentage of mutant than WT cells were binucleated (Student's t test, P = 0.0031).
Similar articles
- RB acute loss induces centrosome amplification and aneuploidy in murine primary fibroblasts.
Iovino F, Lentini L, Amato A, Di Leonardo A. Iovino F, et al. Mol Cancer. 2006 Sep 20;5:38. doi: 10.1186/1476-4598-5-38. Mol Cancer. 2006. PMID: 16987420 Free PMC article. - Induction of centrosome amplification during arsenite-induced mitotic arrest in CGL-2 cells.
Yih LH, Tseng YY, Wu YC, Lee TC. Yih LH, et al. Cancer Res. 2006 Feb 15;66(4):2098-106. doi: 10.1158/0008-5472.CAN-05-2308. Cancer Res. 2006. PMID: 16489010 - Spindle assembly checkpoint and centrosome abnormalities in oral cancer.
Thirthagiri E, Robinson CM, Huntley S, Davies M, Yap LF, Prime SS, Paterson IC. Thirthagiri E, et al. Cancer Lett. 2007 Dec 18;258(2):276-85. doi: 10.1016/j.canlet.2007.09.008. Epub 2007 Oct 23. Cancer Lett. 2007. PMID: 17959302 - Centrosome amplification, chromosome instability and cancer development.
Fukasawa K. Fukasawa K. Cancer Lett. 2005 Dec 8;230(1):6-19. doi: 10.1016/j.canlet.2004.12.028. Cancer Lett. 2005. PMID: 16253756 Review. - Centrosome aberrations in hematological malignancies.
Krämer A, Neben K, Ho AD. Krämer A, et al. Cell Biol Int. 2005 May;29(5):375-83. doi: 10.1016/j.cellbi.2005.03.004. Cell Biol Int. 2005. PMID: 15996491 Review.
Cited by
- CSE1L, DIDO1 and RBM39 in colorectal adenoma to carcinoma progression.
Sillars-Hardebol AH, Carvalho B, Beliën JA, de Wit M, Delis-van Diemen PM, Tijssen M, van de Wiel MA, Pontén F, Meijer GA, Fijneman RJ. Sillars-Hardebol AH, et al. Cell Oncol (Dordr). 2012 Aug;35(4):293-300. doi: 10.1007/s13402-012-0088-2. Epub 2012 Jun 19. Cell Oncol (Dordr). 2012. PMID: 22711543 - Linking abnormal mitosis to the acquisition of DNA damage.
Ganem NJ, Pellman D. Ganem NJ, et al. J Cell Biol. 2012 Dec 10;199(6):871-81. doi: 10.1083/jcb.201210040. J Cell Biol. 2012. PMID: 23229895 Free PMC article. Review. - Dido3-dependent HDAC6 targeting controls cilium size.
Sánchez de Diego A, Alonso Guerrero A, Martínez-A C, van Wely KH. Sánchez de Diego A, et al. Nat Commun. 2014 Mar 25;5:3500. doi: 10.1038/ncomms4500. Nat Commun. 2014. PMID: 24667272 Free PMC article. - Role of DIDO1 in Progression of Esophageal Squamous Cell Carcinoma.
Forghanifard MM, Naeimi Khorasanizadeh P, Abbaszadegan MR, Javdani Mallak A, Moghbeli M. Forghanifard MM, et al. J Gastrointest Cancer. 2020 Mar;51(1):83-87. doi: 10.1007/s12029-019-00212-1. J Gastrointest Cancer. 2020. PMID: 30761474 - DIDO as a Switchboard that Regulates Self-Renewal and Differentiation in Embryonic Stem Cells.
Fütterer A, de Celis J, Navajas R, Almonacid L, Gutiérrez J, Talavera-Gutiérrez A, Pacios-Bras C, Bernascone I, Martin-Belmonte F, Martinéz-A C. Fütterer A, et al. Stem Cell Reports. 2017 Apr 11;8(4):1062-1075. doi: 10.1016/j.stemcr.2017.02.013. Epub 2017 Mar 16. Stem Cell Reports. 2017. PMID: 28330622 Free PMC article.
References
- Doxsey S, McCollum D, Theurkauf W. Annu Rev Cell Dev Biol. 2005;21:411–434. - PubMed
- Moritz M, Braunfeld MB, Sedat JW, Alberts B, Agard DA. Nature. 1995;378:638–640. - PubMed
- Rudner AD, Murray AW. Curr Opin Cell Biol. 1996;8:773–780. - PubMed
- Doxsey SJ. Nat Cell Biol. 2001;3:105–108. - PubMed
- Musacchio A, Hardwick KG. Nat Rev Mol Cell Biol. 2002;3:731–741. - PubMed
Publication types
MeSH terms
Substances
LinkOut - more resources
Full Text Sources
Molecular Biology Databases
