Proteolytic activation of monocyte chemoattractant protein-1 by plasmin underlies excitotoxic neurodegeneration in mice - PubMed (original) (raw)
Proteolytic activation of monocyte chemoattractant protein-1 by plasmin underlies excitotoxic neurodegeneration in mice
John J Sheehan et al. J Neurosci. 2007.
Abstract
Exposure of neurons to high concentrations of excitatory neurotransmitters causes them to undergo excitotoxic death via multiple synergistic injury mechanisms. One of these mechanisms involves actions undertaken locally by microglia, the CNS-resident macrophages. Mice deficient in the serine protease plasmin exhibit decreased microglial migration to the site of excitatory neurotransmitter release and are resistant to excitotoxic neurodegeneration. Microglial chemotaxis can be signaled by the chemokine monocyte chemoattractant protein-1 (MCP-1)/CCL2 (CC chemokine ligand 2). We show here that mice genetically deficient for MCP-1 phenocopy plasminogen deficiency by displaying decreased microglial recruitment and resisting excitotoxic neurodegeneration. Connecting these pathways, we demonstrate that MCP-1 undergoes a proteolytic processing step mediated by plasmin. The processing, which consists of removal of the C terminus of MCP-1, enhances the potency of MCP-1 in in vitro migration assays. Finally, we show that infusion of the cleaved form of MCP-1 into the CNS restores microglial recruitment and excitotoxicity in plasminogen-deficient mice. These findings identify MCP-1 as a key downstream effector in the excitotoxic pathway triggered by plasmin and identify plasmin as an extracellular chemokine activator. Finally, our results provide a mechanism that explains the resistance of plasminogen-deficient mice to excitotoxicity.
Figures
Figure 1.
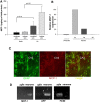
MCP-1 expression increases during excitotoxicity. A, Levels were determined by ELISA 24 h after PBS or KA injection unilaterally into the hippocampus of wt mice. Hippocampal homogenates were prepared from the injected and uninjected sides of the brains. Values of p are noted in the graph. B, Time course of MCP-1 increase on the injected side determined using ELISA. The day 1 (D1) levels of MCP-1 protein were set to 100. Data are the mean of results obtained from three mice ± SD. p < 0.0001 between uninjected and D1; p = 0.0001 between uninjected and D3; p = 0.28 between uninjected and D5. C, Colocalization of the astrocytic marker GFAP (green) with MCP-1 (red) in the CA3 hippocampal subfield of hippocampi from kainate-injected mice 3 d postinjection. D, RT-PCR amplification of MCP-1 from purified neurons and microglia (μglia). As controls, the purity of the cultures and quality of cDNA were confirmed using primers specific for neuronal [amyloid precursor protein (APP)] and microglial (F4/80) markers.
Figure 2.
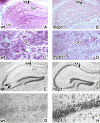
MCP-1 is required for excitotoxic death. wt (A, C, E, G) or MCP-1−/− (B, D, F, H) mice were injected unilaterally with 0.75 nmol of KA and killed at day 5. Panels display coronal sections of the injected hippocampus. A, B, E, and F are low-magnification images, and C, D, G, and H are high-magnification images. In A–D, microglia were visualized using F4/80 immunohistochemistry. In E–H, neuronal viability was visualized using cresyl violet and quantified (n = 8 mice per genotype; *p < 0.05). E, F, Representative images included in the quantification. The arrows in E point to the CA3 region, which undergoes neurodegeneration in wt animals but is spared in the MCP-1−/− mice. G, H, Extensive neurodegeneration is also observed in the CA1 region in wt mice but not in the MCP-1−/− mice.
Figure 3.
Plasmin processes MCP-1 after excitotoxicity. A, ELISA showing the ratio of expression of MCP-1 in hippocampal lysates from tPA−/− and plg−/− mice in comparison with wild-type mice 1 d after KA injection. The experiment was performed in triplicate using three mice per genotype. The MCP-1 expression levels in wild-type mice at day 1 after KA injection were set to 100, as in Figure 1_B_, and the expression levels in tPA−/− and plg−/− are reported relative to those in wild-type hippocampi. Data are presented as mean ± SD. The p values between tPA−/− or plg−/− and wt samples are indicated on the graph. The p value between tPA−/− and plg−/− samples was 0.007. B, Incubation of [35S]methionine-labeled recombinant 6×-His-full-length-MCP-1 with tPA and plasmin. The reaction products were analyzed by 12% SDS-PAGE and subjected to autoradiography. 6×-His-FL-MCP-1 (−, first lane) is indicated by the uppermost arrowhead. The lower two arrowheads denote cleavage products observed after incubation with plasmin (pln). Numbers to the left indicate molecular weight markers. C, Western blot analysis of hippocampal extracts prepared 3 d after KA injection in wild-type (wt KA) and plg−/− (plg−/− KA) mice. Extracts from hippocampi from PBS-injected wt (wt PBS) and plg−/− (plg−/− PBS) mice were used to visualize the starting levels of MCP-1. Recombinant MCP-1-EGFP was used as a control for the MCP-1 antibody (Ctr) (R&D Systems). D, Time course of recombinant MCP-1 cleavage by plasmin. Reaction products were separated on a 16% Tris-Tricine gel and silver stained. Numbers on the left side denote the sizes of ladder bands. E, The bands corresponding to FL MCP-1 and the 13 kDa cleavage fragment shown in D were quantified using optical density, corrected for lane background, and normalized to time 0 value. N = 5.
Figure 4.
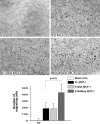
Plasmin-mediated cleavage of MCP-1 is necessary for microglial migration. Migration of plg−/− primary microglia was assessed using an in culture migration assay. The cultures were spotted adjacent to a point source of HBSS containing no addition, Ctr (A), plasmin (B), FL MCP-1 (C), or plasmin-processed MCP-1 (D), and then overlaid with medium. The arrowheads indicate the border of the agarose drop; the arrows point to migrating microglia. The number of migrating cells is reported as mean ± SD.
Figure 5.
C-terminal truncation of MCP-1 increases its potency. Equal molar concentrations of FL, K104A, and K104Stop MCP-1 were tested for their ability to recruit microglia using a Boyden chamber. The cellular staining intensity of the migrating cells was quantified using Scion Image. Data are presented as the mean staining intensity ± SD (n = 3) after subtraction of background for random cell movement (cells responding to buffer only). p = 0.009 between K104Stp MCP-1 and FL MCP-1.
Figure 6.
Plasmin-mediated cleavage of MCP-1 induces microglial migration and promotes excitotoxicity in plg−/− mice. A–H, FL, K104A, and K104Stop MCP-1 and plasmin-processed MCP-1 were delivered into plg−/− mice (n = 5) 2 d before intrahippocampal KA injection. Brains were processed 5 d later, using F4/80 to visualize microglia accumulating at the regions of cell death (A–D) or cresyl violet to determine the extent of cell death (E–H). There was no effect of the infusion or injection on the uninjected hippocampus. The panels display photomicrographs of coronal sections taken through the hippocampal injected side. The arrowheads in B point to the densely F4/80-immunopositive layers of microglia accumulated around the site of injury (CA1–CA3). Neuronal death was confirmed by TUNEL staining (I–K).
Similar articles
- Role of MCP-1 and CCR2 in ethanol-induced neuroinflammation and neurodegeneration in the developing brain.
Zhang K, Wang H, Xu M, Frank JA, Luo J. Zhang K, et al. J Neuroinflammation. 2018 Jul 5;15(1):197. doi: 10.1186/s12974-018-1241-2. J Neuroinflammation. 2018. PMID: 29976212 Free PMC article. - Acute excitotoxic injury induces expression of monocyte chemoattractant protein-1 and its receptor, CCR2, in neonatal rat brain.
Galasso JM, Miller MJ, Cowell RM, Harrison JK, Warren JS, Silverstein FS. Galasso JM, et al. Exp Neurol. 2000 Oct;165(2):295-305. doi: 10.1006/exnr.2000.7466. Exp Neurol. 2000. PMID: 10993690 - The C terminus of mouse monocyte chemoattractant protein 1 (MCP1) mediates MCP1 dimerization while blocking its chemotactic potency.
Yao Y, Tsirka SE. Yao Y, et al. J Biol Chem. 2010 Oct 8;285(41):31509-16. doi: 10.1074/jbc.M110.124891. Epub 2010 Aug 3. J Biol Chem. 2010. PMID: 20682771 Free PMC article. - Clinical implications of the involvement of tPA in neuronal cell death.
Tsirka SE. Tsirka SE. J Mol Med (Berl). 1997 May;75(5):341-7. doi: 10.1007/s001090050119. J Mol Med (Berl). 1997. PMID: 9181475 Review. - Tissue plasminogen activator as a modulator of neuronal survival and function.
Tsirka SE. Tsirka SE. Biochem Soc Trans. 2002 Apr;30(2):222-5. Biochem Soc Trans. 2002. PMID: 12023855 Review.
Cited by
- Physiologic variations in blood plasminogen levels affect outcomes after acute cerebral thromboembolism in mice: a pathophysiologic role for microvascular thrombosis.
Singh S, Houng AK, Wang D, Reed GL. Singh S, et al. J Thromb Haemost. 2016 Sep;14(9):1822-32. doi: 10.1111/jth.13390. Epub 2016 Aug 6. J Thromb Haemost. 2016. PMID: 27319402 Free PMC article. - Small extracellular vesicles encapsulating CCL2 from activated astrocytes induce microglial activation and neuronal apoptosis after traumatic spinal cord injury.
Rong Y, Ji C, Wang Z, Ge X, Wang J, Ye W, Tang P, Jiang D, Fan J, Yin G, Liu W, Cai W. Rong Y, et al. J Neuroinflammation. 2021 Sep 12;18(1):196. doi: 10.1186/s12974-021-02268-y. J Neuroinflammation. 2021. PMID: 34511129 Free PMC article. - Brain extracellular matrix in neurodegeneration.
Bonneh-Barkay D, Wiley CA. Bonneh-Barkay D, et al. Brain Pathol. 2009 Oct;19(4):573-85. doi: 10.1111/j.1750-3639.2008.00195.x. Epub 2008 Jul 25. Brain Pathol. 2009. PMID: 18662234 Free PMC article. Review. - Tissue-type plasminogen activator as a therapeutic target in stroke.
Gravanis I, Tsirka SE. Gravanis I, et al. Expert Opin Ther Targets. 2008 Feb;12(2):159-70. doi: 10.1517/14728222.12.2.159. Expert Opin Ther Targets. 2008. PMID: 18208365 Free PMC article. Review. - Plasmin-dependent modulation of the blood-brain barrier: a major consideration during tPA-induced thrombolysis?
Niego B, Medcalf RL. Niego B, et al. J Cereb Blood Flow Metab. 2014 Aug;34(8):1283-96. doi: 10.1038/jcbfm.2014.99. Epub 2014 Jun 4. J Cereb Blood Flow Metab. 2014. PMID: 24896566 Free PMC article. Review.
References
- Amin N, Pearce B. Glutamate toxicity in neuron-enriched and neuron-astrocyte co-cultures: effect of the glutamate uptake inhibitor l-trans-pyrrolidine-2,4-dicarboxylate. Neurochem Int. 1997;30:271–276. - PubMed
- Andersson P, Perry V, Gordon S. The kinetics and morphological characteristics of the macrophage-microglial response to kainic acid-induced neuronal degeneration. Neuroscience. 1991;42:201–214. - PubMed
- Banisadr G, Queraud-Lesaux F, Boutterin M, Pelaprat D, Zalc B, Rostene W, Haour F, Parsadaniantz S. Distribution, cellular localization and functional role of CCR2 chemokine receptors in adult rat brain. J Neurochem. 2002;81:257–269. - PubMed
- Batchelor P, Liberatore G, Wong J, Porritt M, Frerichs F, Donnan G, Howells D. Activated macrophages and microglia induce dopaminergic sprouting in the injured striatum and express brain-derived neurotrophic factor and glial cell line-derived neurotrophic factor. J Neurosci. 1999;19:1708–1716. - PMC - PubMed
- Block M, Li G, Qin L, Wu X, Pei Z, Wang T, Wilson B, Yang J, Hong J. Potent regulation of microglia-derived oxidative stress and dopaminergic neuron survival: substance P vs. dynorphin. FASEB J. 2006;20:251–258. - PubMed
Publication types
MeSH terms
Substances
LinkOut - more resources
Full Text Sources
Medical
Molecular Biology Databases
Research Materials
Miscellaneous


