In vivo fluorescent imaging of the mouse retina using adaptive optics - PubMed (original) (raw)
In vivo fluorescent imaging of the mouse retina using adaptive optics
David P Biss et al. Opt Lett. 2007.
Abstract
In vivo imaging of the mouse retina using visible and near infrared wavelengths does not achieve diffraction-limited resolution due to wavefront aberrations induced by the eye. Considering the pupil size and axial dimension of the eye, it is expected that unaberrated imaging of the retina would have a transverse resolution of 2 microm. Higher-order aberrations in retinal imaging of human can be compensated for by using adaptive optics. We demonstrate an adaptive optics system for in vivo imaging of fluorescent structures in the retina of a mouse, using a microelectromechanical system membrane mirror and a Shack-Hartmann wavefront sensor that detects fluorescent wavefront.
Figures
Fig. 1
(Color online) Experimental setup. DM, deformable mirror, SHWS, Shack–Hartmann wavefront sensor. PMT, photomultiplier tube for confocal detection of fluorescence, HS, polygon scanner for the horizontal scan. VS, galvanometric mirror for the vertical scan, OBJ, imaging objective, EYE, mouse eye sample.
Fig. 2
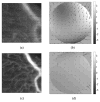
In vivo images of retinal blood vessels injected with an Evan’s Blue solution and measured SHWS spot displacements (arrows) with calculated wavefront (gray-scale image). The pupil at the SHWS is 4 mm across, and lenslets are 300 _μ_m in diameter and have a 7 mm focal length. (a) Image without AO correction. (b) Wavefront measurements before AO correction. (c) Image with AO correction. (d) Wavefront measurements after AO correction. The wavefront scale bar represents −3 to 3 _μ_m.
Fig. 3
In vivo images of GFP-labeled microglia in the retina. (a) Without AO correction. A line plot is given for the region of the image that corresponds to the white line. (b) With AO correction. In (a) and (b) pixel intensity from the original, unprocessed image along the white line is plotted on the same scale. (c) Ex vivo flat-mount image of the same retina. The dimension bar is 50 _μ_m. Both inlayed line plots have the same x and y scale.
Similar articles
- Shack-Hartmann wavefront-sensor-based adaptive optics system for multiphoton microscopy.
Cha JW, Ballesta J, So PT. Cha JW, et al. J Biomed Opt. 2010 Jul-Aug;15(4):046022. doi: 10.1117/1.3475954. J Biomed Opt. 2010. PMID: 20799824 Free PMC article. - Effect of aberrations and scatter on image resolution assessed by adaptive optics retinal section imaging.
Wanek JM, Mori M, Shahidi M. Wanek JM, et al. J Opt Soc Am A Opt Image Sci Vis. 2007 May;24(5):1296-304. doi: 10.1364/josaa.24.001296. J Opt Soc Am A Opt Image Sci Vis. 2007. PMID: 17429475 Free PMC article. - Large-field-of-view imaging by multi-pupil adaptive optics.
Park JH, Kong L, Zhou Y, Cui M. Park JH, et al. Nat Methods. 2017 Jun;14(6):581-583. doi: 10.1038/nmeth.4290. Epub 2017 May 8. Nat Methods. 2017. PMID: 28481364 Free PMC article. - In vivo high-resolution retinal imaging using adaptive optics.
Seyedahmadi BJ, Vavvas D. Seyedahmadi BJ, et al. Semin Ophthalmol. 2010 Sep-Nov;25(5-6):186-91. doi: 10.3109/08820538.2010.518483. Semin Ophthalmol. 2010. PMID: 21090998 Review. - [Histology of the living eye : Noninvasive microscopic structure and functional analysis of the retina with adaptive optics].
Domdei N, Reiniger JL, Pfau M, Charbel Issa P, Holz FG, Harmening WM. Domdei N, et al. Ophthalmologe. 2017 Mar;114(3):206-214. doi: 10.1007/s00347-016-0411-9. Ophthalmologe. 2017. PMID: 27995325 Review. German.
Cited by
- Two-photon excitation fluorescence in ophthalmology: safety and improved imaging for functional diagnostics.
Kaushik V, Dąbrowski M, Gessa L, Kumar N, Fernandes H. Kaushik V, et al. Front Med (Lausanne). 2024 Jan 3;10:1293640. doi: 10.3389/fmed.2023.1293640. eCollection 2023. Front Med (Lausanne). 2024. PMID: 38235268 Free PMC article. Review. - Introduction to the Feature Issue on Adaptive Optics for Biomedical Applications.
Sabesan R, Grieve K, Hammer DX, Ji N, Marcos S. Sabesan R, et al. Biomed Opt Express. 2023 Mar 30;14(4):1772-1776. doi: 10.1364/BOE.488044. eCollection 2023 Apr 1. Biomed Opt Express. 2023. PMID: 37078031 Free PMC article. - Retinal microvascular and neuronal pathologies probed in vivo by adaptive optical two-photon fluorescence microscopy.
Zhang Q, Yang Y, Cao KJ, Chen W, Paidi S, Xia CH, Kramer RH, Gong X, Ji N. Zhang Q, et al. Elife. 2023 Apr 11;12:e84853. doi: 10.7554/eLife.84853. Elife. 2023. PMID: 37039777 Free PMC article. - Evolution of adaptive optics retinal imaging [Invited].
Williams DR, Burns SA, Miller DT, Roorda A. Williams DR, et al. Biomed Opt Express. 2023 Feb 28;14(3):1307-1338. doi: 10.1364/BOE.485371. eCollection 2023 Mar 1. Biomed Opt Express. 2023. PMID: 36950228 Free PMC article. Review. - From mouse to human: Accessing the biochemistry of vision in vivo by two-photon excitation.
Palczewska G, Wojtkowski M, Palczewski K. Palczewska G, et al. Prog Retin Eye Res. 2023 Mar;93:101170. doi: 10.1016/j.preteyeres.2023.101170. Epub 2023 Feb 12. Prog Retin Eye Res. 2023. PMID: 36787681 Free PMC article. Review.
References
- Paques M, Simonutti M, Roux MJ, Picaud S, Levavassuer E, Bellman C, Sahel JA. Vision Res. 2006;46:1336. - PubMed
- Higashide T, Kawaguchi I, Ohkubo S, Takeda H, Sugiyama K. Invest Opthalmol Visual Sci. 2006;47:2943. - PubMed
- García de la Cera E, Rodríguez G, Llorente L, Schaeffel F, Marcos S. Vision Res. 2006;46:2546. - PubMed
- Liang J, Williams DR, Miller D. J Opt Soc Am A. 1997;14:2884. - PubMed
- Roorda A, Williams DR. Nature. 1999;397:520. - PubMed
Publication types
MeSH terms
Grants and funding
- R01 EY004395/EY/NEI NIH HHS/United States
- EY-14106/EY/NEI NIH HHS/United States
- R01 EY004395-25/EY/NEI NIH HHS/United States
- R01 EB000664/EB/NIBIB NIH HHS/United States
- R01 EY014106/EY/NEI NIH HHS/United States
- EY-014375/EY/NEI NIH HHS/United States
- R01 EY014375/EY/NEI NIH HHS/United States
- R01 EB000664-02/EB/NIBIB NIH HHS/United States
LinkOut - more resources
Full Text Sources


