Activation of microglia acidifies lysosomes and leads to degradation of Alzheimer amyloid fibrils - PubMed (original) (raw)
Activation of microglia acidifies lysosomes and leads to degradation of Alzheimer amyloid fibrils
Amitabha Majumdar et al. Mol Biol Cell. 2007 Apr.
Abstract
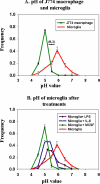
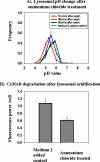
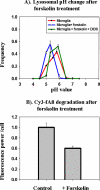
Microglia are the main immune cells of the brain, and under some circumstances they can play an important role in removal of fibrillar Alzheimer amyloid beta peptide (fAbeta). Primary mouse microglia can internalize fAbeta, but they do not degrade it efficiently. We compared the level of lysosomal proteases in microglia and J774 macrophages, which can degrade fAbeta efficiently, and we found that microglia actually contain higher levels of many lysosomal proteases than macrophages. However, the microglial lysosomes are less acidic (average pH of approximately 6), reducing the activity of lysosomal enzymes in the cells. Proinflammatory treatments with macrophage colony-stimulating factor (MCSF) or interleukin-6 acidify the lysosomes of microglia and enable them to degrade fAbeta. After treatment with MCSF, the pH of microglial lysosomes is similar to J774 macrophages (pH of approximately 5), and the MCSF-induced acidification can be partially reversed upon treatment with an inhibitor of protein kinase A or with an anion transport inhibitor. Microglia also degrade fAbeta if lysosomes are acidified by an ammonia pulse-wash or by treatment with forskolin, which activates protein kinase A. Our results indicate that regulated lysosomal acidification can potentiate fAbeta degradation by microglia.
Figures
Figure 1.
Lysosomal pH measurements in live cells. J774 macrophages and microglia were loaded with fluorescein-rhodamine-dextran for 16 h followed by a 4-h chase. Fluorescein/rhodamine ratio values were measured for individual lysosomes and compared with calibration curves generated from fixed cells in various pH buffers. (A) Frequency distribution of lysosomal pH in macrophages (green curve) and microglia (red curve). (B) Frequency distribution of lysosomal pH in microglia after treatment with 200 ng/ml LPS for 16 h, 200 ng/ml IL-6 for 16 h, or 25 ng/ml MCSF for 5 d. Data for lysosomal pH measurements for each experiment and for each condition were obtained from at least 750 lysosomes from four different fields, and the data shown here are pH values obtained from four different experiments done on four different days. Error bars represent the SEM. The horizontal bar on the figure shows the SD (±0.1 pH unit) for the measurement of pH values in cells fixed at pH 5.5.
Figure 2.
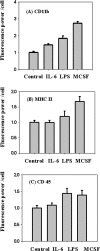
Expression of cell surface markers on microglia. Microglia were treated with 200 ng/ml IL-6 for 16 h, 200 ng/ml LPS for 16 h, or 25 ng/ml MCSF for 5 d, and expression of cell surface markers CD11b, MHC II, and CD45 were measured using digital imaging of immunofluorescence. The figure shows the fluorescence power (arbitrary units) per cell for the treated and untreated cells. CD 11b (A), MHC II (B), and CD 45 (C). Error bars are SEM from six different experiments done on six different days.
Figure 3.
Degradation of Cy3 fAβ in treated and untreated microglia. Microglia were treated with 200 ng/ml LPS for 16 h, 200 ng/ml IL-6 for 16 h, or 25 ng/ml MCSF for 5 d. After the treatment, cells were incubated for 60 min with 5 μg/ml Cy3-fAβ, rinsed, and chased for 72 h. After the chase period, the cells were rinsed, fixed, and imaged by digital fluorescence microscopy. The integrated Cy3 fluorescence power per cell before and after the chase was quantified. The figure shows the percentage of the Cy3 signal retained in the cells after the 72-h chase period with respect to the Cy3 signal at a 0-h chase. The data presented here are the average from six different experiments done on different days. Error bars represent the SEM.
Figure 4.
Artificial lysosomal acidification causes degradation of Cy3-fAβ by microglia. (A) Lysosomal pH measurements. Microglia were incubated with fluorescein-rhodamine dextran for 16 h followed by a 4-h chase. The cells were pulsed with 25 mM NH4Cl for 30 min, followed by rinsing and incubation in medium without NH4Cl for 15, 45, or 60 min. At each time, lysosomal pH measurements were obtained from at least 750 lysosomes from four different fields, and the pH values from four different experiments done on four different days are shown. Error bars represent the SEM. (B) Degradation of Cy3-fAβ. Microglia were incubated for 60 min with 5 μg/ml Cy3-fAβ and chased for 72 h. During the chase period, lysosomes were acidified by ammonium pulse-wash Cy3 fluorescence power after 72 h normalized to the fluorescence power before the chase. The data represent the average of the normalized intensity values from four different experiments done on four different days. Error bars represent the SEM.
Figure 5.
Forskolin treatment causes lysosome acidification and degradation of Cy3f-Aβ by microglia. (A) Lysosomal pH was measured 45 min after addition of 200 μM forskolin. Where indicated, 1 mM DIDS was added 15 min before forskolin addition. Lysosomal pH measurements were obtained from at least 750 lysosomes from four different fields. The average pH values from four different experiments from four different days are shown. Error bars represent the SEM. (B) Microglia were incubated for 60 min with 7 μg/ml Cy3-fAβ and chased for 72 h. During the chase period, the cells were treated with 45-min pulses of 200 μM forskolin to activate PKA during the 1st, 6th, 24th, and 48th h. Cy3 fluorescence power after 72 h normalized to the fluorescence power at the 0-h time point. The data shown here represent average of the normalized intensity values from four different experiments done on four different days. Error bars represent the SEM.
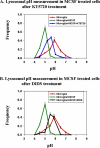
Figure 6.
Lysosomal pH measurements in activated microglia in presence of PKA inhibitor and chloride channel blocker. Lysosomal pH was measured in treated and untreated microglia. For measurements with PKA inhibitor, KT 5720 at 10 μM was added to MCSF-treated microglia, and pH was measured 45 min after addition. For measurements in the presence of the chloride channel blocker DIDS at 1 mM was added to MCSF-treated microglia, and lysosomal pH was measured 60 min after the addition of DIDS. (A) Frequency distribution of lysosomal pH in MCSF-treated microglia (green curve), untreated microglia (red curve), and KT 5720-treated activated microglia (blue curve). (B) Frequency distribution of lysosomal pH in MCSF-treated activated microglia (green curve), untreated microglia (red curve), and DIDS-treated activated microglia (black curve). Lysosomal pH measurements were obtained from at least 750 lysosomes from three different fields. The average pH values from three different experiments from three different days are shown. Error bars represent the SEM.
Similar articles
- Degradation of Alzheimer's amyloid fibrils by microglia requires delivery of ClC-7 to lysosomes.
Majumdar A, Capetillo-Zarate E, Cruz D, Gouras GK, Maxfield FR. Majumdar A, et al. Mol Biol Cell. 2011 May 15;22(10):1664-76. doi: 10.1091/mbc.E10-09-0745. Epub 2011 Mar 25. Mol Biol Cell. 2011. PMID: 21441306 Free PMC article. - Degradation of fibrillar forms of Alzheimer's amyloid beta-peptide by macrophages.
Majumdar A, Chung H, Dolios G, Wang R, Asamoah N, Lobel P, Maxfield FR. Majumdar A, et al. Neurobiol Aging. 2008 May;29(5):707-15. doi: 10.1016/j.neurobiolaging.2006.12.001. Epub 2007 Jan 11. Neurobiol Aging. 2008. PMID: 17222479 Free PMC article. - Deacetylation of TFEB promotes fibrillar Aβ degradation by upregulating lysosomal biogenesis in microglia.
Bao J, Zheng L, Zhang Q, Li X, Zhang X, Li Z, Bai X, Zhang Z, Huo W, Zhao X, Shang S, Wang Q, Zhang C, Ji J. Bao J, et al. Protein Cell. 2016 Jun;7(6):417-33. doi: 10.1007/s13238-016-0269-2. Epub 2016 May 21. Protein Cell. 2016. PMID: 27209302 Free PMC article. - The endocytic pathway in microglia during health, aging and Alzheimer's disease.
Solé-Domènech S, Cruz DL, Capetillo-Zarate E, Maxfield FR. Solé-Domènech S, et al. Ageing Res Rev. 2016 Dec;32:89-103. doi: 10.1016/j.arr.2016.07.002. Epub 2016 Jul 12. Ageing Res Rev. 2016. PMID: 27421577 Free PMC article. Review. - Lysosomal acidification dysfunction in microglia: an emerging pathogenic mechanism of neuroinflammation and neurodegeneration.
Quick JD, Silva C, Wong JH, Lim KL, Reynolds R, Barron AM, Zeng J, Lo CH. Quick JD, et al. J Neuroinflammation. 2023 Aug 5;20(1):185. doi: 10.1186/s12974-023-02866-y. J Neuroinflammation. 2023. PMID: 37543564 Free PMC article. Review.
Cited by
- Inflammation as common link to progressive neurological diseases.
Dias-Carvalho A, Sá SI, Carvalho F, Fernandes E, Costa VM. Dias-Carvalho A, et al. Arch Toxicol. 2024 Jan;98(1):95-119. doi: 10.1007/s00204-023-03628-8. Epub 2023 Nov 15. Arch Toxicol. 2024. PMID: 37964100 Free PMC article. Review. - Chronic IL-1β-mediated neuroinflammation mitigates amyloid pathology in a mouse model of Alzheimer's disease without inducing overt neurodegeneration.
Matousek SB, Ghosh S, Shaftel SS, Kyrkanides S, Olschowka JA, O'Banion MK. Matousek SB, et al. J Neuroimmune Pharmacol. 2012 Mar;7(1):156-64. doi: 10.1007/s11481-011-9331-2. Epub 2011 Dec 16. J Neuroimmune Pharmacol. 2012. PMID: 22173340 Free PMC article. - Complement component C3 and complement receptor type 3 contribute to the phagocytosis and clearance of fibrillar Aβ by microglia.
Fu H, Liu B, Frost JL, Hong S, Jin M, Ostaszewski B, Shankar GM, Costantino IM, Carroll MC, Mayadas TN, Lemere CA. Fu H, et al. Glia. 2012 May;60(6):993-1003. doi: 10.1002/glia.22331. Epub 2012 Mar 21. Glia. 2012. PMID: 22438044 Free PMC article. - Uncovering molecular biomarkers that correlate cognitive decline with the changes of hippocampus' gene expression profiles in Alzheimer's disease.
Gómez Ravetti M, Rosso OA, Berretta R, Moscato P. Gómez Ravetti M, et al. PLoS One. 2010 Apr 13;5(4):e10153. doi: 10.1371/journal.pone.0010153. PLoS One. 2010. PMID: 20405009 Free PMC article. - Cholesterol and matrisome pathways dysregulated in astrocytes and microglia.
Tcw J, Qian L, Pipalia NH, Chao MJ, Liang SA, Shi Y, Jain BR, Bertelsen SE, Kapoor M, Marcora E, Sikora E, Andrews EJ, Martini AC, Karch CM, Head E, Holtzman DM, Zhang B, Wang M, Maxfield FR, Poon WW, Goate AM. Tcw J, et al. Cell. 2022 Jun 23;185(13):2213-2233.e25. doi: 10.1016/j.cell.2022.05.017. Cell. 2022. PMID: 35750033 Free PMC article.
References
- Aronoff D. M., Canetti C., Serezani C. H., Luo M., Peters-Golden M. Cutting edge: macrophage inhibition by cyclic AMP (cAMP): differential roles of protein kinase A and exchange protein directly activated by cAMP-1. J. Immunol. 2005;174:595–599. - PubMed
- Awano T., Katz M. L., O'Brien D. P., Sohar I., Lobel P., Coates J. R., Khan S., Johnson G. C., Giger U., Johnson G. S. A frame shift mutation in canine TPP1 (the ortholog of human CLN2) in a juvenile Dachshund with neuronal ceroid lipofuscinosis. Mol. Genet. Metab. 2006;89:254–260. - PubMed
- Bae H. R., Verkman A. S. Protein kinase A regulates chloride conductance in endocytic vesicles from proximal tubule. Nature. 1990;348:637–639. - PubMed
- Bard F., et al. Peripherally administered antibodies against amyloid beta-peptide enter the central nervous system and reduce pathology in a mouse model of Alzheimer disease. Nat. Med. 2000;6:916–919. - PubMed
- Brazil M. I., Chung H., Maxfield F. R. Effects of incorporation of immunoglobulin G and complement component C1q on uptake and degradation of Alzheimer's disease amyloid fibrils by microglia. J. Biol. Chem. 2000;275:16941–16947. - PubMed
Publication types
MeSH terms
Substances
Grants and funding
- NS-34761/NS/NINDS NIH HHS/United States
- R01 DK054317/DK/NIDDK NIH HHS/United States
- R01 DK027083/DK/NIDDK NIH HHS/United States
- R01 NS034761/NS/NINDS NIH HHS/United States
- DK-27083/DK/NIDDK NIH HHS/United States
- DK-54317/DK/NIDDK NIH HHS/United States
- R37 DK027083/DK/NIDDK NIH HHS/United States
LinkOut - more resources
Full Text Sources
Other Literature Sources
Research Materials
