Trichostatin A increases SMN expression and survival in a mouse model of spinal muscular atrophy - PubMed (original) (raw)
. 2007 Mar;117(3):659-71.
doi: 10.1172/JCI29562. Epub 2007 Feb 22.
Affiliations
- PMID: 17318264
- PMCID: PMC1797603
- DOI: 10.1172/JCI29562
Trichostatin A increases SMN expression and survival in a mouse model of spinal muscular atrophy
Amy M Avila et al. J Clin Invest. 2007 Mar.
Abstract
The inherited motor neuron disease spinal muscular atrophy (SMA) is caused by mutation of the telomeric survival motor neuron 1 (SMN1) gene with retention of the centromeric SMN2 gene. We sought to establish whether the potent and specific hydroxamic acid class of histone deacetylase (HDAC) inhibitors activates SMN2 gene expression in vivo and modulates the SMA disease phenotype when delivered after disease onset. Single intraperitoneal doses of 10 mg/kg trichostatin A (TSA) in nontransgenic and SMA model mice resulted in increased levels of acetylated H3 and H4 histones and modest increases in SMN gene expression. Repeated daily doses of TSA caused increases in both SMN2-derived transcript and SMN protein levels in neural tissues and muscle, which were associated with an improvement in small nuclear ribonucleoprotein (snRNP) assembly. When TSA was delivered daily beginning on P5, after the onset of weight loss and motor deficit, there was improved survival, attenuated weight loss, and enhanced motor behavior. Pathological analysis showed increased myofiber size and number and increased anterior horn cell size. These results indicate that the hydroxamic acid class of HDAC inhibitors activates SMN2 gene expression in vivo and has an ameliorating effect on the SMA disease phenotype when administered after disease onset.
Figures
Figure 1. TSA activates the SMN2 gene in vitro.
(A) The SMA fibroblast cell line 2906 was treated with 0–50 nM TSA, and SMN+7 and SMNΔ7 mRNA was measured after 4 hours. Values represent mean ± SEM of 5 separate experiments. (B) The SMA fibroblast cell line 3813 was treated with 50 nM TSA, and SMN+7 and SMNΔ7 mRNA levels were determined over a period of 0–72 hours. Values represent mean ± SEM of 2 experiments for the 2-, 4-, 17-, and 24-hour time points and 1 experiment for the 0.5-, 1-, 5-, 48-, and 72-hour time points.
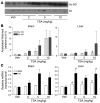
Figure 2. TSA treatment increases histone acetylation and gene expression in nontransgenic mice.
(A) Representative Western blot showing acetylated H3 (Ac H3) histones compared with H1 histone levels in the brains of nontransgenic mice 2 hours after treatment with vehicle (Veh) or with 2, 5, or 10 mg/kg TSA. Each lane represents an individual animal. (B) Quantification of acetylated H3 and H4 histones in the brains and livers of nontransgenic mice treated with vehicle or with 2, 5, or 10 mg/kg TSA. (C) Mouse Smn and follistatin (Foll) mRNA levels after treatment with vehicle or with 2, 5, or 10 mg/kg TSA. Values represent mean ± SEM of 3 mice per group. *P < 0.01; #P < 0.05.
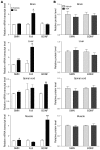
Figure 3. A single dose of TSA increases Smn gene expression but not SMN protein levels in nontransgenic mice.
(A) Smn, follistatin, and BDNF mRNA levels and (B) SMN and BDNF protein levels were determined in brains, livers, spinal cords, and muscle tissues 2 hours after nontransgenic mice were treated with a single dose of TSA (10 mg/kg; n = 8) or vehicle (n = 7). BDNF mRNA levels were too low in liver to be reliably measured. Values represent mean ± SEM. #P < 0.05; *P < 0.01; **P < 0.001.
Figure 4. Repeated doses of TSA increase SMN+7 mRNA levels and SMN protein levels in SMA mice.
(A) SMN+7, SMNΔ7, follistatin, and BDNF mRNA levels and (B and C) SMN and BDNF protein levels were determined in brain, liver, spinal cord, and muscle isolated 4 hours after the last dose from SMA mice treated daily from P5 through P13. (B) Western blots, with each lane representing 1 animal. In the upper panels, the upper bands show full-length SMN protein; the lower bands show SMNΔ7 protein. (C) Quantification of Western blots shown in B. Lanes denoted with arrowheads were excluded as underloaded relative to the other visualized lanes. SMN protein bands were not visible in the muscle of untreated SMA mice, although they were evident in treated mice; therefore, quantification of the changes in muscle SMN protein levels was limited. Values represent mean ± SEM. #P < 0.05; *P < 0.01; **P < 0.001.
Figure 5. TSA treatment increases snRNP assembly activity in brains of SMA mice.
(A) snRNP assembly reactions were carried out using in vitro transcribed radioactive U1 snRNA and 25 mg of brain extracts from either vehicle- or TSA-treated SMA mice. Following immunoprecipitation with anti-Sm antibodies, input (2.5%) and immunoprecipitated U1 snRNAs were analyzed by electrophoresis on 10% polyacrylamide, 8M urea denaturing gels and autoradiography. (B) Quantification of relative snRNP assembly activity in brain extracts from vehicle- and TSA-treated SMA mice. Brain extracts from either vehicle-treated (n = 5) or TSA-treated (n = 7) SMA mice were prepared and analyzed by snRNP assembly and immunoprecipitation experiments as in A, and the amount of immunoprecipitated U1 snRNA was quantified as described in Methods. Values represent mean ± SEM. *P < 0.01.
Figure 6. TSA increases survival, attenuates weight loss, and enhances motor behavior of SMA mice.
SMA mice and their WT and heterozygous littermates were treated with daily intraperitoneal injections of TSA (10 mg/kg) or vehicle on days P5–P20. (A) Four mice from the same litter at P13, showing the gross appearance of a TSA-treated SMA mouse, a vehicle-treated SMA mouse, a heterozygous (Het) mouse, and a WT mouse. (B) Kaplan-Meier survival curves of mice treated with TSA (n = 23) or vehicle (n = 22). P < 0.0003, log-rank test. (C) Weights of SMA mice treated with TSA (n = 26) or vehicle (n = 22), heterozygous mice treated with TSA (n = 52) or vehicle (n = 49), and WT mice treated with TSA (n = 30) or vehicle (n = 30). (D) Righting time in SMA mice treated with TSA (n = 20) or vehicle (n = 15), heterozygous mice treated with TSA (n = 29) or vehicle (n = 37), and WT mice treated with TSA (n = 12) or vehicle (n = 19).
Figure 7. TSA increases AHC size but not AHC number.
SMA mice were treated with vehicle (n = 3) or TSA (n = 3) and heterozygous littermates were treated with vehicle (n = 3) on days P5–P13. (A) Nissl-stained cross-sections of lumbar spinal cord showing 1 ventral horn. Scale bars: 10 μm. (B) Median ventral horn neuron number was reduced in SMA mice compared with heterozygous littermates (P < 0.0001) and was not changed by TSA treatment. Lines represent median values, boxes represents the twenty-fifth and seventy-fifth percentiles, whiskers represent values within 1.5 times the interquartile range, and dots represent outliers. (C) Median ventral horn neuron size was increased in heterozygous mice compared with SMA mice (P < 0.0001) and was increased by TSA treatment (P = 0.003). (D) ChAT mRNA levels were determined in spinal cord isolated from SMA mice treated daily with vehicle (n = 5) or TSA (n = 5) and heterozygous littermates treated with vehicle (n = 6) on days P5–P13.
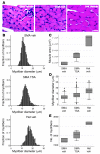
Figure 8. TSA increases myofiber size and number in SMA mice.
SMA mice were treated with vehicle (n = 3) or TSA (n = 3) and heterozygous littermates were treated with vehicle (n = 3) on days P5–P13. (A) H&E-stained cross-sections of TA muscle. Scale bars: 10 μm. (B) Histograms of myofiber diameters. (C) Median TA muscle cross-sectional area was reduced in SMA mice compared with heterozygous littermates (P = 0.05) and increased with TSA treatment (P = 0.03). Lines represent median values, boxes represents the twenty-fifth and seventy-fifth percentiles, whiskers represent values within 1.5 times the interquartile range, and dots represent outliers. (D) Median myofiber diameter in the TA muscle was reduced in SMA mice compared with heterozygous littermates (P < 0.0001) and increased with TSA treatment (P < 0.0001). (E) Median TA muscle total myofiber number was reduced in SMA mice compared with heterozygous littermates (P = 0.05) and increased with TSA treatment (P = 0.08).
Figure 9. TSA increases maturity of SMA myofibers.
(A) Pax7, desmin, MyoD, and myogenin and (B) embryonic, perinatal, and adult MyHC mRNA levels were determined in muscle isolated from SMA mice treated daily with vehicle (n = 5) or TSA (n = 6) and heterozygous littermates treated with vehicle (n = 5) on days P5–P13. Values represent mean ± SEM.
Similar articles
- The role of histone acetylation in SMN gene expression.
Kernochan LE, Russo ML, Woodling NS, Huynh TN, Avila AM, Fischbeck KH, Sumner CJ. Kernochan LE, et al. Hum Mol Genet. 2005 May 1;14(9):1171-82. doi: 10.1093/hmg/ddi130. Epub 2005 Mar 16. Hum Mol Genet. 2005. PMID: 15772088 - The benzamide M344, a novel histone deacetylase inhibitor, significantly increases SMN2 RNA/protein levels in spinal muscular atrophy cells.
Riessland M, Brichta L, Hahnen E, Wirth B. Riessland M, et al. Hum Genet. 2006 Aug;120(1):101-10. doi: 10.1007/s00439-006-0186-1. Epub 2006 May 25. Hum Genet. 2006. PMID: 16724231 - In vitro and ex vivo evaluation of second-generation histone deacetylase inhibitors for the treatment of spinal muscular atrophy.
Hahnen E, Eyüpoglu IY, Brichta L, Haastert K, Tränkle C, Siebzehnrübl FA, Riessland M, Hölker I, Claus P, Romstöck J, Buslei R, Wirth B, Blümcke I. Hahnen E, et al. J Neurochem. 2006 Jul;98(1):193-202. doi: 10.1111/j.1471-4159.2006.03868.x. J Neurochem. 2006. PMID: 16805808 - Therapeutics development for spinal muscular atrophy.
Sumner CJ. Sumner CJ. NeuroRx. 2006 Apr;3(2):235-45. doi: 10.1016/j.nurx.2006.01.010. NeuroRx. 2006. PMID: 16554261 Free PMC article. Review. - Molecular mechanisms of spinal muscular atrophy.
Sumner CJ. Sumner CJ. J Child Neurol. 2007 Aug;22(8):979-89. doi: 10.1177/0883073807305787. J Child Neurol. 2007. PMID: 17761653 Review.
Cited by
- Triptolide increases transcript and protein levels of survival motor neurons in human SMA fibroblasts and improves survival in SMA-like mice.
Hsu YY, Jong YJ, Tsai HH, Tseng YT, An LM, Lo YC. Hsu YY, et al. Br J Pharmacol. 2012 Jun;166(3):1114-26. doi: 10.1111/j.1476-5381.2012.01829.x. Br J Pharmacol. 2012. PMID: 22220673 Free PMC article. - Induction of full-length survival motor neuron by polyphenol botanical compounds.
Sakla MS, Lorson CL. Sakla MS, et al. Hum Genet. 2008 Jan;122(6):635-43. doi: 10.1007/s00439-007-0441-0. Epub 2007 Oct 26. Hum Genet. 2008. PMID: 17962980 - Histone deacetylase degradation and MEF2 activation promote the formation of slow-twitch myofibers.
Potthoff MJ, Wu H, Arnold MA, Shelton JM, Backs J, McAnally J, Richardson JA, Bassel-Duby R, Olson EN. Potthoff MJ, et al. J Clin Invest. 2007 Sep;117(9):2459-67. doi: 10.1172/JCI31960. J Clin Invest. 2007. PMID: 17786239 Free PMC article. - HDAC4 Inhibitors as Antivascular Senescence Therapeutics.
Huang C, Lin Z, Liu X, Ding Q, Cai J, Zhang Z, Rose P, Zhu YZ. Huang C, et al. Oxid Med Cell Longev. 2022 Jun 29;2022:3087916. doi: 10.1155/2022/3087916. eCollection 2022. Oxid Med Cell Longev. 2022. PMID: 35814270 Free PMC article. Review. - Spinal muscular atrophy: development and implementation of potential treatments.
Arnold WD, Burghes AH. Arnold WD, et al. Ann Neurol. 2013 Sep;74(3):348-62. doi: 10.1002/ana.23995. Ann Neurol. 2013. PMID: 23939659 Free PMC article. Review.
References
- Munsat T.L., Davies K.E. International SMA consortium meeting. June 26–28, 1992. Bonn, Germany. Neuromuscul. Disord. 1992;2:423–428. - PubMed
- Lefebvre S., et al. Identification and characterization of a spinal muscular atrophy-determining gene. Cell. 1995;80:155–165. - PubMed
- Frugier T., Nicole S., Cifuentes-Diaz C., Melki J. The molecular bases of spinal muscular atrophy. Curr. Opin. Genet. Dev. 2002;12:294–298. - PubMed
Publication types
MeSH terms
Substances
LinkOut - more resources
Full Text Sources
Other Literature Sources
Medical
Molecular Biology Databases
Research Materials
Miscellaneous


